
How to get "exact P values" from multiple comparisons tests that follow one-way or two-way ANOVA
Most of the multiple comparisons tests report 95% confidence intervals for the difference between means, and also reports which of those comparisons are statistically significant after accounting for the number of comparisons.
Many scientists want more. They ask us to report "exact P values" from multiple comparisons. The quick answer is: Yes, Prism 6 can report multiplicity adjusted P values from many multiple comparisons tests. Read on to see what this means.
Statistical principles
The distinction between P values and statistical hypothesis testing
When you make one comparison, it is easy to gloss over the difference between reporting a P value and using statistical hypothesis testing to report a conclusion of whether or not that difference is "statistically significant". But the two are somewhat distinct:
- A P value is a measure of strength-of-evidence -- of how well (or how poorly) your data comply with the null hypothesis.
- A statement of 'significance' is a way to divide all your tests into two piles -- ones that you think are worthy of follow up ('significant'), and those that are not.
Multiple comparisons applies to a set of comparisons, and not to any one particular comparison
When you make several comparisons at once, there is a huge distinction between P values and statistical hypothesis testing. The methods of statistical hypothesis testing can be adjusted to account for the fact you are making multiple comparisons at one time. When you make one comparison, you usually set alpha to 5% which means: If the null hypothesis is true, there is a 5% chance of ending up with a 'statistically significant' result just by chance. When you are making multiple comparisons, you can set things up so that 5% value applies to the entire family of comparisons. The 5% is said to be the family-wise error rate. This means that if all the null hypotheses were true, there is a 5% chance that one or more of the differences will be 'statistically significant' simply due to random variation, leaving a 95% chance that all the comparisons will be 'not significant'.
Reporting an individual P value, by its very nature, is a way to express the strength-of-evidence for that one comparison. It doesn't really make a lot of sense to compute individual P values (but see below)
Prism 5 let you choose the significance level (0.05, 0.01, or 0.001). Whatever significance level you choose, it also displays asterisks to denote the smallest of those significance levels at which the comparison is statistically significant.
How to report "exact" P values from multiple comparisons?
This is a common question, but it has three alternative answers:
Answer 1: Don't bother
The whole idea of statistical hypothesis testing is to make a crisp decision from comparison. That is the only reason to use the term "statistical significance".
In many situations in science, this is not a useful way of thinking about the data. You don't need to make a decision from each comparison, so don't need each comparison to be reported as "statistically significant" or not. In these cases, you can ignore the significance conclusions altogether, and (perhaps) also ignore the P value.
Instead focus on the confidence intervals. Many find it much simpler to think about confidence intervals rather than P values. Note that the confidence intervals reported with multiple comparisons tests adjust for multiple comparisons. Given the usual assumptions, you can be 95% confident that all the intervals contain the true population value, which leaves a 5% chance that one or more of the intervals do not include the population value. These are simulataneous confidence intervals.
Answer 2: Multiplicity adjusted P values. GraphPad Prism 6 (but not earlier versions) can do this.
A multiplicity adjusted P value is the family-wise significance level at which that particular comparison would just barely be considered statistically significant. That is a hard concept to grasp. You can set the threshold of significance, for the whole family of comparisons, to any value you want. Usually, it is set to 0.05 or 0.01 or perhaps 0.10. But it can be set to any value you want, perhaps 0.0345. The adjusted P value is the smallest significance threshold, for the entire family of comparisons, at which this one comparison would be declared "statistically significant".
The adjusted P value for each comparison depends on all the data, not just the data in the two groups that P value compares. If you added one more comparison to the study (or took one away), all the adjusted P values would change. The adjusted P value can be thought of as a measure of the strength of evidence. Prism does not yet compute adjusted P values, but this is high on our priority list. Think twice before reporting adjusted P values. They are a bit hard to understand. And since they are not commonly reported, they may be misunderstood by others.
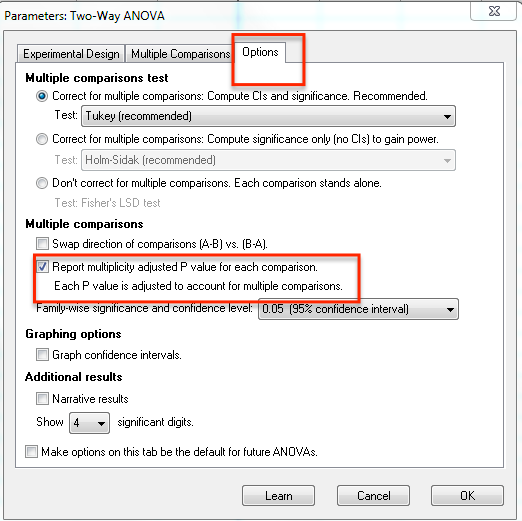
If you check an option on the Options tab of the one- or two-way ANOVA dialog (shown below), Prism 6 will report multiplicity adjusted P values with many multiple comparisons tests. Earlier versions of Prism do not have this option.
Answer 3: Fisher's Least Significant Differences. P values that don't correct for multiple comparisons. Prism 6, but not earlier versions, can do this.
An alternative to adjusted P values is to compute a P value (and confidence interval) for each comparison, without adjusting for multiple comparisons. This is sometimes called the unprotected Fisher's Least Significant Difference (LSD) test. The results will be similar to performing independent t tests for each comparison, except the Fishers LSD test uses all the data to compute a pooled standard deviation (rather than using the variation only in the two groups being compared). This will usually give it more power than independent t tests. Since the Fishers LSD test does not correct for multiple comparisons, it is easy to be mislead by the results. Most statisticians recommend against using it. Some argue that it should be used, and explained, and that the correction for multiple comparisons should be made by the reader rather than by the scientist publishing the results.
Prism 6 reports the Fisher's LSD test, but earlier versions do not.
Adjusted P values are very different than Fisher's LSD P values
Note the huge difference: Adjusted P values correct for multiple comparisons; Fishers LSD test does not. The "exact" P values computed by the two methods, therefore, will give very different results and must be interpreted very differently. If you report either, be sure to be very explicit about exactly what P value you are reporting.
Keywords: Tukey, newman keuls, posthoc, Dunnett, exact P value, multiple comparison, post test