
Area under dose-response data
The idea
When comparing many concentration-response curves (or dose-response curves) run with a small number of doses (concentrations), it is not always possible to determine the EC50 (or IC50), slope, and maximum effect (or maximum inhibition) with reasonable precision. Instead, investigators sometimes compare the area under the dose response data.
Details
A few notes on these calculations:
- Although investigators sometimes say they compute the area under the dose-response “curve”, it really only makes sense to compute area under the dose-response data, not under a fit curve. If you have enough quality data to fit a dose-response curves and determine the EC50 (or IC50), slope and maximum effect with reasonably narrow confidence intervals, then compare those parameters. Comparing area under the dose response relationship is a strategy to use when you are not able to determine those parameters with precision.
- If the X values are equally spaced, then Prism’s AUC calculations are equivalent to taking a weighted average of all the Y values, giving the Y values corresponding to the lowest and highest X values half the weight of the other points. If the X values are not equally spaced, The area is still a weighted average of the responses, but the weights account for the unequal spacing with the responses corresponding the the widely spaced doses having more weight than responses from doses that are more closely spaced.
- The area under the curve reported by Prism is the area under the “curve” created by connecting the responses with straight lines. Its units are the X units (usually log concentration) times the Y units. It is not really possible to interpret these units, but all you’ll care about is comparing the area determined under different conditions or with different cell lines.
- You can only compare areas computed with exactly the same set of X values. If the data sets use different doses or concentrations, so have a different set of X values, any comparison of area would be meaningless.
- Prism's AUC analysis asks you to specify a baseline for the area. You can enter Y=0 or Y equal to some other baseline value measured using appropriate controls.
- If you entered replicate (say triplicate) Y values for each X, Prism's AUC analysis averages these and only the mean is entered into the calculations of the AUC, but the variation among replicates lets Prism compute the SE of the AUC and its 95% CI.
- If you want to compare areas under dose-response data from two data sets, focus on the difference rather than the ratio. You'll get a different ratio if you define the baseline differently.
Example
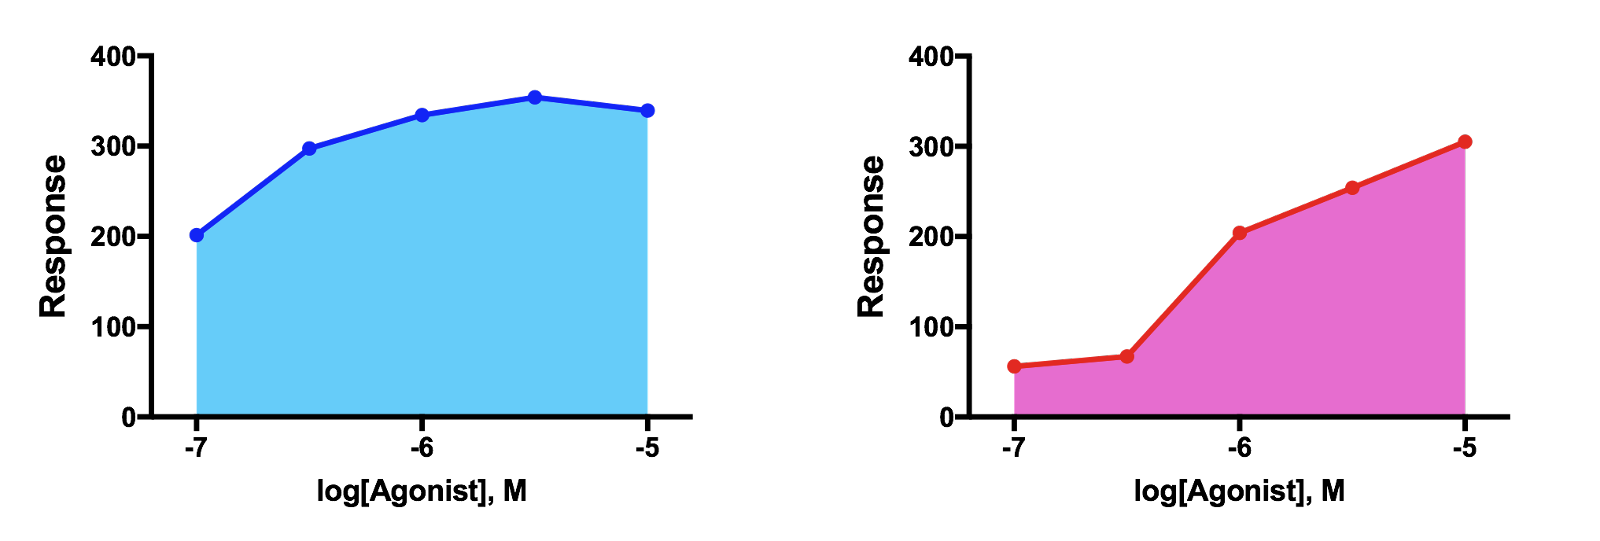
Here are some log(concentration) vs. response data.


The data was collected over a narrow range of concentrations, and any attempt to fit a dose-response model wouldn't work very well. The confidence intervals would be wide, and would probably depend on somewhat arbitrary decisions about constraining the Top, Bottom, or Slope of the curve.
Instead of fitting a curve, we'll simply measure the area under the dose response relationship. These graphs show what we'll be measuring.
To compute the two area-under-the-curve (AUC) values use Prism's AUC analysis using the default settings.


To compare these two AUCs, copy and paste the AUC and the SE values into a new Grouped table formatted for entry of mean, SEM, and n. Define the df for each group as the number of data points for that group (15) minus the number of concentrations (5). For n, enter one more than the df (11). When Prism does the t tests, it will subtract 1 from the entered n to obtain the df, which will now be correct (10). [This part of the faq was edited in January 2019; the df were wrong before that.]
For and enter the n values as number of concentrations.

Then run an unpaired t test.

In most cases, the most useful results from a t test is the confidence interval for the difference between the two means (two AUCs in this case). But since the units of the AUC are not really interpretable, neither is that CI. So the useful result is the P value, which tiny. If this experiment were part of a large series of screening tests, the low P value would tell you the drug tested here is worthy of further testing.