
How can I figure out if two drugs are additive or synergistic?
The concept of synergy is very complicated
When you apply two drugs to a system, is the response more than you'd predict from the two individual responses? If so, the two drugs are said to act synergistically. How do you analyze your data to figure out if this is the case? Sounds like an easy question. But in fact, it is pretty tricky. This brief article (by Greco and colleagues) gives some perspective on the complexity of the problem, and is essential reading for anyone beginning to think about synergy. A much longer review is also worth reading.
The main point to take away from those two articles is that the question "Are these two drugs synergistic?" is not simple. It depends on what response you are looking at, and how you define synergy. It is not possible for a computer program to answer that question for you until you have clearly defined the question.
If you are thinking about two drugs working on different sites on the same receptor, read up on allosteric interactions. This is a special case of drug synergy with well-developed methods of data analysis.
Testing for Bliss independence with Prism
The rest of this page explains how to test for additivity of two drugs. The term "additive" is, in fact, a slippery term with multiple definitions. For this article, we'll use the definition of Bliss. This is appropriate when both drugs act on the same system (at least down stream) so the maximum response provoked by both drugs is the same. The rule is that the fractional response of a combination of two drugs (assuming Bliss's independence) equals the sum of the two fractional responses minus their product.
Think of it this way. The fractional response to drug A alone at any particular dose is Fa. Similarly, the fractional response of drug B alone is Fb. But what is the additional response of drug B once A is already present? The additional response to drug B is the fraction Fb times the remaining possible response, which is 1-Fa, So the additional response due to drug B, in the presence of drug A equals Fb*(1-Fa). Therefore, the total response to a mixture of the two drugs is Fa+Fb(1-Fa) which equals Fa+Fb-Fa*Fb. This equation assumes that the effects of the two drugs are additive.
We'll assume that you apply the two drugs in 1:1 ratio. This means that each X value is the concentration for both drugs (each drug the same, so the total concentration added is twice the X value). Note that the model does not assume that the two EC50 values are the same, but it does assume the two Hill Slopes are the same.
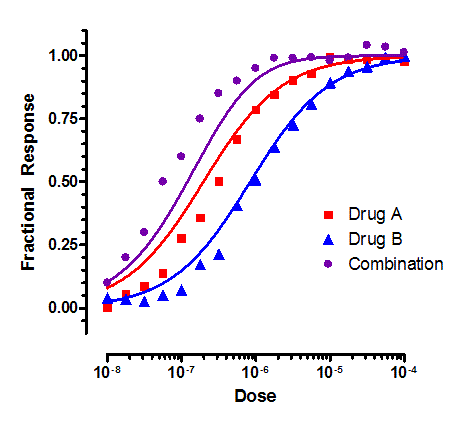
Here is a user-defined model, written for Prism, that can fit those three curves:
The first line defines the first dose reponse curve, with its own logEC50 and slope. In this example, all three curves are assumed to have a baseline of zero and a top plateau of 1.0 (the data have been normalized to fractional response). The second row defines the second dose-response curve. The third line tells Prism that for dataset A, Y is defined as Fa (defined in the first row). The next line defines the model for dataset B. The last line, defines the Y (response) for dataset C according to the Bliss independence rule. Note that this model as written assumes that the X values are logarithms of concentrations.
We fit the data, sharing all the parameters. This is important. You must share the two logEC50 values, so the fit for curve C is derived from (is consistent with) the fits for curve A and B.
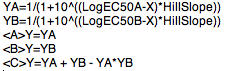
Below is an example of data that conforms to the additive model. The dose-response curve for drugs A and B administered together is very close to the sum of the two individual dose-response curves.
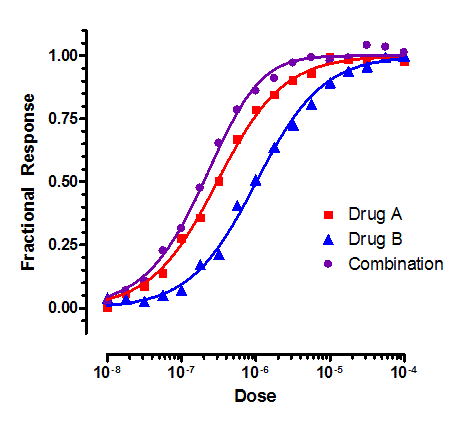
In contrast, the figure below shows drugs that act synergistically.
The curves are fit assuming the two drugs act in an "additive" or "independent" manner, and these curves don't fit the data well. This tells us that the additive model is inadequate.
It would be nice at this point to fit the data to an alternative model that takes into account the synergism between the two drugs. I don't know of an explicit model to use, so won't pursue that. But if these were my data, I'd try to come up with an alternative model that does fit the data well. Then I'd use the F test to compare the two models.
You may download the Prism file I used to create the graphs above.
Keywords: isobologram, synergy