- Prism
FEATURES
Analyze, graph and present your workComprehensive analysis and statisticsElegant graphing and visualizationsShare, view and discuss your projectsLatest product features and releasesPOPULAR USE CASES
- Enterprise
- Resources
- Support
- Pricing
Prism 8.4.0 Release Notes
Prism 8.4.0 was released on March 03, 2020.
Violins get an upgrade!
With Prism 8.0, Violin plots were introduced as a way to visually approximate the distribution of a data set. Prior to this release, violin plots in Prism did not extend above or below the maximum or minimum values in the data set. This resulted in an appearance of the violins being "truncated" at these values. Violin plots can be a little tricky to understand at first. Instead of presenting the distribution of the entered data (which is known), violin plots represent an estimated distribution of the population from which the data may have been sampled from (which is not known, but is based on the entered data). Because this estimated population is likely to contain values greater or less than the entered data, full violin plots will generally extend above and below these values. With 8.4.0, we now offer the ability to select if you'd like to display a truncated violin plot (on the left below) or a full violin plot (on the right below) when generating this visualization.

More confidence with Logistic Regression
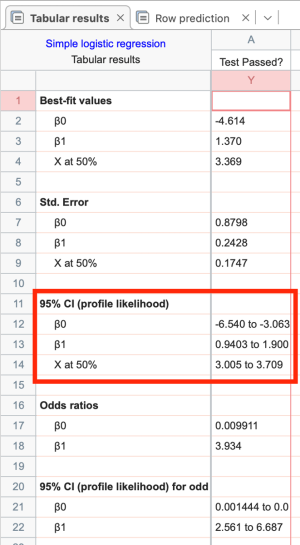
Simple and Multiple logistic regression were added in Prism 8.3.0, and we heard lots of great feedback from all of you! We listened to all of your feedback, and - based on your requests and comments - we've made some improvements to these analyses. First, when performing Simple Logistic Regression, Prism will now report a confidence interval for the parameter X at Y=50.
Additionally, when performing Simple Logistic Regression (or Multiple Logistic Regression with a single independent variable), you now have the option to plot confidence bands with the associated Logistic Plot!

Even more Color Schemes and Colormaps!
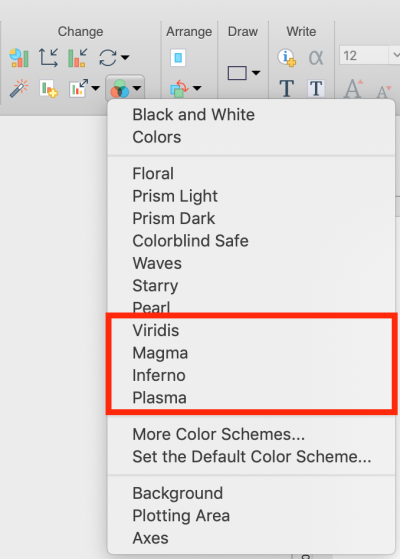
Prism 8.4.0 also introduces four new* colormaps for generating heat maps. These four colormaps are:
Viridis

Magma

Inferno

Plasma

*Many of you may recognize some of these color schemes from throughout scientific literature. These colormaps were originally developed for the python package matplotlib by Nathaniel J. Smith, Stefan van der Walt, and Eric Firing. Since their creation, these colormaps have been integrated in a number of various software platforms including MATLAB as well as R. We're happy to announce that they are also now available for use when generating heat maps in Prism as well!
When generating heat maps of your data, you can easily select any of these four options, with Viridis being implemented as the new default colormap for heat maps.
To complement these new colormaps for heat maps, we've also introduced four new color schemes inspired by these colormaps that can be used for all of your other graph types. You can find these new color schemes by using the Change Colors button in the Change section of the Toolbar.
Stay Connected!
Your feedback and suggestions were the main driving force behind these new features in Prism 8.4.0. Do you have other ideas for new features? Suggestions for improvements to existing features? Email us at suggestions@graphpad.com to let us know!
Complete release notes for Prism 8.4.0
New Features
- When creating violin plots, choose to show the complete violin, or to truncate the violin at the min/max of the entered data
- Colormaps "Viridis", "Magma", "Inferno", and "Plasma" available for heat maps and are available as presets in the Change Graph Type and Create New Graph dialogs as well as in the Colormap dropdown of the Format Graph dialog
- Default colormap for heatmaps changed to Viridis (previously Rainbow)
- Four new color schemes inspired by the "Magma", "Inferno", "Plasma", and "Viridis" colormaps
Feature Improvements
- Added confidence interval of X at Y=50 for Simple Logistic regression
- Added confidence bands for the logistic curve from Simple and Multiple Logistic regressions
- Improved the appearance of the heat map icons in "Create New Graph" and "Change Graph Type" dialogs
- Disabled a number of multiple comparisons tests with the "no sphericity" option selected for main effects in unmatched repeated measures designs. Read more about this change
- Made the multiple comparisons tab of the "Two-way ANOVA" analysis results blank, displaying the floating note "This analysis was performed by an older version of Prism. This combination of assumptions and multiple comparisons was misleading and is no longer available. Details."
- Allowed creating a graph after normalizing for any kind of table (previously just XY), and improved the Normalize analysis dialog
- Improved the default Y-axis labels for Kaplan-Meier Survival analysis graphs. Previously, the Y axis title read "Percent Survival", but now reads "Probability of Survival"
- Added analytic representation of the "Two-phase decay" exponential built-in equation
- Improved the parameter dialog of the Frequency Distribution analysis
- Reworded the text for the checkbox "Wilcoxon. When both values on a row are identical, use method of Praff" in the "Options" tab of the "Parameters: t tests (and Nonparametric Tests)" dialog
- When creating a correlation matrix from a data table without column titles, the results sheet containing the correlation matrix now includes default column/row titles
- Changed the default option for "Report differences as:" on the Analysis tab of the Nested t test parameters dialog from "Column A - Column B" to "Column B - Column A"
- Updated the default graph for grouped data tables to be scatter plots instead of bar plots
- Added an alert to Prism 8.4 that that future versions will support 64-bit operating systems only. This alert will only be displayed when launching Prism on a 32-bit system (Windows)
- (Windows) Improved auto-recovery feature to handle corrupted files that crashed older versions of Prism
- (Windows) Enabled support of multi-line row titles in data/results tables embedded on a graph
- (Windows) Enabled 'Bold', 'Italic', and 'Underline' buttons in 'Column titles' and 'Subcolumn Titles' tabs in the 'Format Data Table' dialog for multiple selected cells
- (Windows) Enabled the 'Cut' command for multiple selected titles in the 'Subcolumn Titles' tab of the 'Format Data Table' dialog
- (Windows) Improved the layout and look of the 'Create New Graph' dialog
- (Windows) Made the 'View Gallery (see all sheets)' button on the bottom toolbar indicate that the gallery view is active
- (Windows) Disabled the 'Equalize spacing' drop-down button in the toolbar while less than three objects were selected on the layout sheet
Performance (Speed) Improvements
- Improved performance of opening large projects with many thousands of data points
- Improved performance of opening projects containing hundreds of thousands of data points on a single graph
- (Windows) Improved performance of opening projects containing several data tables with more than one million data points in each
- (Windows) Improved performance of opening projects containing the 'Transform' analysis of large data sets
- (Windows) Improved performance of the mixed-effects model with one random factor (e.g. "Nested t test/ANOVA", 1-way RM ANOVA analyses, etc.)
- (Windows) Improved performance of the 'Multiple Linear Regression' and 'Multiple Logistic Regression' analyses when the source data table contains a large number of values
- (Windows) Improved performance of the 'Simple Logistic Regression' analysis when the X column contains a large number of values
- (Windows) Improved performance of the 't test (and nonparametric)' analysis when the source data table contained a large number of values
- (Windows) Improved performance of switching to data tables when saving Prism file while on a layout with graphs containing many data sets
Analysis Bug Fixes
- Fixed the mismatched factor names on the "Means" tab of the 3-way ANOVA results sheet
- Fixed the issue in which the P value for the "O vs. E" binomial test in Prism 8 was different from Prism 7
- Fixed the issue in which Prism would crash when you cancel the calculation of the Kruskal-Wallis test
- Fixed the issue in which all data sets would disappear from the "Normalize" results sheet if the first data set was excluded from the source data table
- Fixed the incorrect ordering of columns and/or rows in the "Extract and Rearrange" analysis results if the grouping variable was defined
- Fixed the issue in which the "Simple Logistic Regression" analysis constants were still present in the "Hook Constant" dialog after data was deleted/excluded in the source data table
- Fixed links to the the online Help ("Learn more" links in the floating notes, dialogs, and Interpret toolbar button) for the "Multiple Logistic Regression" and "Simple Logistic Regression" analyses
- Fixed the "Learn more" link in the note for "Identify 'unstable'" option for non-linear regression analyses
- Fixed the incorrect built-in model Equation "EC50 shift, X is concentration"
- (Windows) Limited the "Number of segments" field in the Fit Spline/LOWESS parameters dialog to values less than 500,000
- (Windows) Fixed the issue in which an empty results sheet appeared after performing the "Select and transform" analysis with checked "Rows" option on the "Select rows" tab of the parameters dialog
- (Mac) Fixed the issue in which results of the "Normalize" analysis were incorrect if data from the first row was missing and the analysis was performed with the options "Normalize each subcolumn separately" and "Remove from the results page" options, or the options "Average the subcolumns..." and "Last mean in each data set" selected
- (Mac) Fixed the issue in which the result of the "Normalize" analysis were incorrect if the source data table was grouped with "Mean, Upper/Lower Limits", but the means were not included within the given limits
- (Mac) Fixed the issue in which "β" characters were replaced with question marks on the results sheets of "Simple Logistic regression", "Multiple Linear Regression", and "Multiple Logistic Regression" analyses
Graphing Bug Fixes
- Fixed the issue in which a heat map gave different colors for the same values
- Fixed the issue in which Prism was unable to open a .pzfx file with a large nubmer of imported images on graphs and layouts
- Fixed the issue in which part of a heat map created from the "Correlation Matrix" analysis appeared white after deleting some data sets in the source data table with a large number of columns
- Fixed the issue in which the order of data sets on a graph was reversed when a Prism file created on Windows was opened on a Mac
- Fixed the issue in which files from previous versions of Prism did not show the "line of identity" in ROC curve graphs
- Fixed the issue in which newly added data sets from the "Format Graph" dialog appeared as bars after placing them on "Low-high", "Box & Whiskers", or "Violin" graphs from the "Nested" graph family
- Fixed the issue in which files from previous versions of Prism did not show the "line of identity" on ROC graphs
- (Windows) Fixed the issue in which a tick label on the Y axis was unexpectedly clipped after the X axis was hidden and the graph was resized to fill the page
- (Windows) Fixed the issue in which the top and bottom borders of violin plots were unexpectedly thinner at the axis limits
- (Windows) Fixed the issue in which area fill was not appropriately applied to the entire graph when the Y axis intersected the curve to which area fill was being applied
- (Windows) Fixed the issue in which zig-zag lines unexpectedly shifted to the left after duplicating the graph family or copying and pasting the graph into another application
- (Windows) Fixed the issue in which graphs containing a large number of data points got unexpectedly resized and repositioned on a layout while using a high-DPI display
- (Windows) Fixed the missing graph preview in the "Built-in Equation" dialog opened from "Nonlinear Regression", "Interpolate a standard curve", or "Plot a function" parameters dialogs
- (Windows) Fixed the issue in which an error line was unexpectedly plotted for excluded or missing data if the error line style had been set to solid or dotted line and the "For point-to-point connecting..." radio button had been set to "Leave a gap"
- (Mac) Fixed the issue in which the curve and its symbols would unexpectedly differ in color after applying the color scheme to the graph of non-linear regression analysis performed on transformed data
- (Mac) Fixed a graph rendering issue in which white lines unexpectedly appeared on a graph after changing the background color and adjusting the zoom level on MacOS
- (Mac) Fixed the issue when newly added data sets unexpectedly appeared as bars, after placing them on "Low-High", "Box&Whiskers", or "Violin" graphs from the "Nested" graph family
- (Mac) Fixed the issue in which the "Homoscedasticity plot" graph appeared instead of the "Heatmap plot" graph after changing RM One-way ANOVA tests to the Friedman test in the "Parameters: One-way ANOVA" dialog
Other Bug Fixes
- Fixed the issue in which images added to layout sheets from MS PowerPoint presentations appeared blurry when exported from Prism to raster format
- Fixed the issue in which the wrong floating note was displayed if a sheet was frozen and saved in an older version of Prism
- Removed "Hold shift and click to draw a series..." text from a tooltip for lines with text in comparisons and drawing buttons
- (Windows) Fixed the issue when downloaded web installer did not launch automatically when updating Prism with certain updates of Windows Defender installed on PC
- (Windows) Fixed the issue with incorrect handling of cell background color when inserting or deleting rows/columns in a data table
- (Windows) Fixed the corruption of data when sharing data table and analysis results using the Send Mail command from within Prism
- (Windows) Fixed the issue in which it was difficult to re-order items by dragging in the "Layouts" section of the Navigator
- (Windows) Fixed the issue that the "Legends and Labels" option in Prism prefs controlled only font size but not font family for manually drawn "Text with lines" objects
- (Windows) Updated the "Paste from clipboard" button and items in the "Paste special..." menu so that they would not appear active on the toolbar when the clipboard is empty
- (Windows) Fixed the "Go To Linked Sheet" command in the contextual menu in the Navigator
- (Windows) Fixed the crash that would when undoing a delete of a data table with linked sheets
- (Windows) Fixed the freeze that occurred when attempting to save an example from the "Welcome" > "Clone a Graph" into a folder (category) with a long name
- (Windows) Fixed the inability to invoke the "Format Graph" dialog after changing "Percentage" to "Fraction" in the "Parameters: ROC Curve" dialog for a project created in Prism 7
- (Windows) Fixed the issue in which checkboxes in the "Analyze which data sets?" section of the "Analyze Data" dialog looked blurred
- (Windows) Fixed the issue in which text on a graph was not moved to the front after sending a line-with-text object from back to front
- (Windows) Fixed the corruption of the edit field on the "Nested" tab of the Welcome dialog on high-DPI displays
- (Windows) Fixed the corruption of elements in the Navigator after changing the "Graph Family" option int he "Change Graph Type" dialog on high-DPI displays
- (Windows) Fixed the corruption of the (Q) edit field in the "Parameters: Analyze a stack of P values" dialog
- (Windows) Fixed the issue in which the name of the results sheet was corrupted on switching between sheets when the Prism file created with version 8.3 or 8.4 was opened in older versions of Prism
- (Windows) Fixed the issue in which the bottom toolbar did not show the X value of the cursor when hovering over the graph
- (Windows) Fixed the issue in which clicking a "Learn" or "Help" button would cause the navigator of the online Help to be collapsed after opening the desired help page
- (Windows) Fixed the "Interpret" button that led to incorrect pages from the "Nested one-way ANOVA" and "Multiple t tests - one per row" analyses results
- (Windows) Fixed the refreshing issue of the "Clone a graph" tab in the Welcome dialog after moving examples between categories
- (Windows, 32-bit only): Fixed the crash that would occur when attempting to create long multi-line data set titles after creating a new graph for each data set
- (Mac) Fixed the issue in which custom sub-column titles were lost after pasting them into another data set
- (Mac) Fixed the corruption of the line-with-text objects on a graph when you apply "Align objects"/"Distribute objects" commands for them
- (Mac) Fixed the issue in which text copied from MS Word was pasted as an image (instead of a text box) onto a Prism graph
- (Mac) Fixed the issue when Prism unexpectedly uses the dot as decimal separator in System Preferences instead of comma set in Prism's preferences when you copy data within Prism's data tables
- (Mac) Fixed the issue in which the "Draw" and "Write" sections of the toolbar appeared disabled after switching from a results sheet to a graph or layout sheet on MacOS 10.15
- (Mac) Fixed the "Interpret" button that led to an incorrect page from "One sample Wilcoxon test"
- (Mac) Added links to help pages in Multiple logistic regression and Simple logistic regression analyses (dialogs, floating notes, the Interpret toolbar button)
- (Mac) Fixed the issue in which Prism would freeze after negative values were entered into the "Plot family of:" field in "Parameters: Plot a Function" dialog
- (Mac) Fixed the crash and broken order of Undo and Redo operations while continuously editing the title and numeric cells in a data table
- (Mac) macOS 10.14, Fixed artifacts on graph after changing data set(s) color options via color picker and changing zoom level
- (Mac) macOS 10.15, Fixed the issue in which the graph preview was empty in teh "Color Scheme" dialog after color scheme was changed for multiple graphs
Analyze, graph and present your scientific work easily with GraphPad Prism. No coding required.