- Prism
FEATURES
Analyze, graph and present your workComprehensive analysis and statisticsElegant graphing and visualizationsShare, view and discuss your projectsLatest product features and releasesPOPULAR USE CASES
- Enterprise
- Resources
- Support
- Pricing
Prism 9.2.0 Release Notes
Prism 9.2.0 was released on July 19, 2021.
Analyze Data Dialog Updates: Searchable Analyses and Recently Used
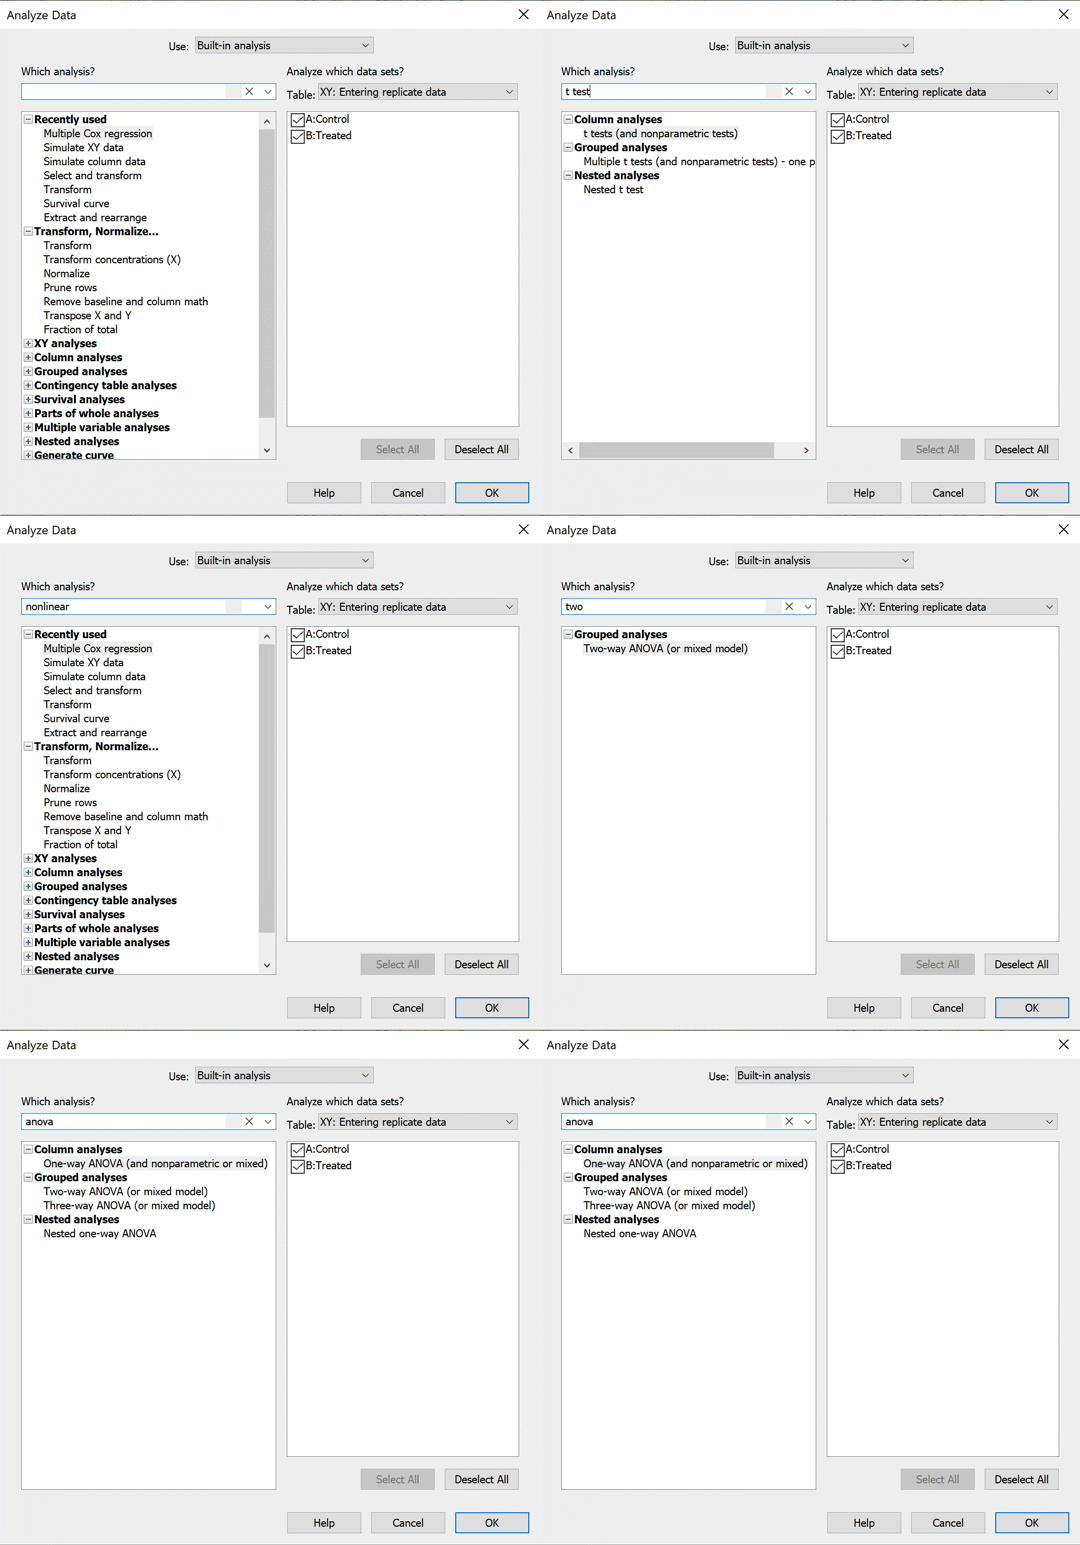
Prism offers a huge array of different analyses that can be used to process or investigate your data. In Prism 9.1.0, the Analyze menu was introduced, providing a new method for accessing Prism's library of analyses. Using built-in system functionality, this menu was fully searchable on macOS (using the search bar found in the Help menu). In Prism 9.2.0, we've introduced a new way to search Prism's library of analyses that can be used on both macOS and Windows. The Analyze Data dialog (accessed by clicking the "Analyze" button in the Prism toolbar) now includes a search bar allowing you to easily find the analysis you're looking for.

We've also made some changes to the organization of the Analyze Data dialog to make it easier for you to find the analyses that you use most often. The "Recently used" folder has been moved to the top of the analysis list for quick and easy access.
New Graph Axis Title Controls
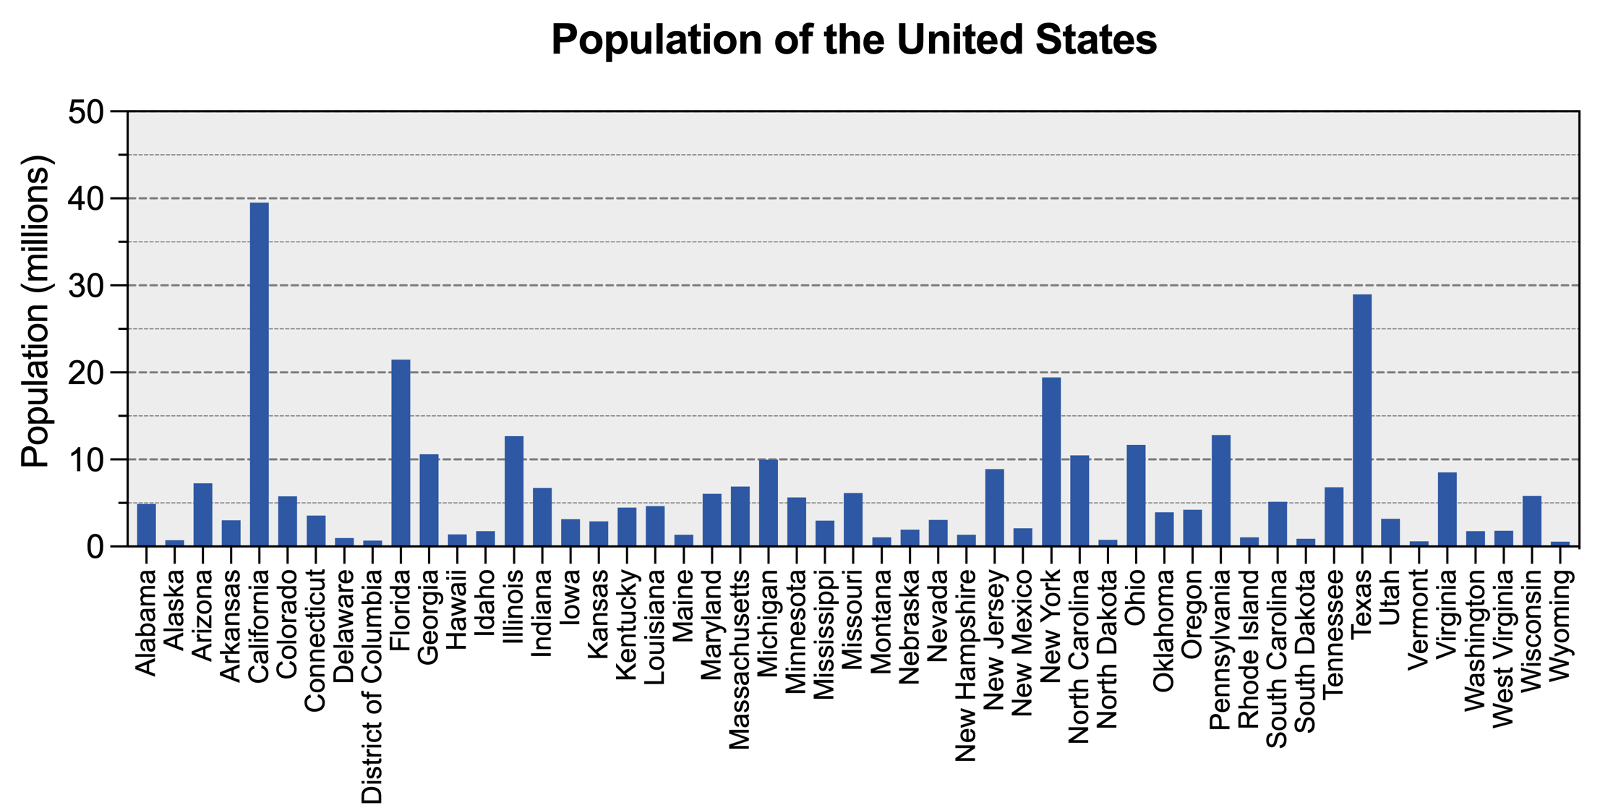
We get it. Creating the perfect looking graph is important. Most of the time, you're focused on getting the right type of graph, the right colors, the right line weights, etc. But something that you may not have considered is the orientation and position of the Y axis title. The "standard" graph includes a Y axis title that is rotated 90° (vertical orientation) and centered on the Y axis. A simple example of this approach is shown below:

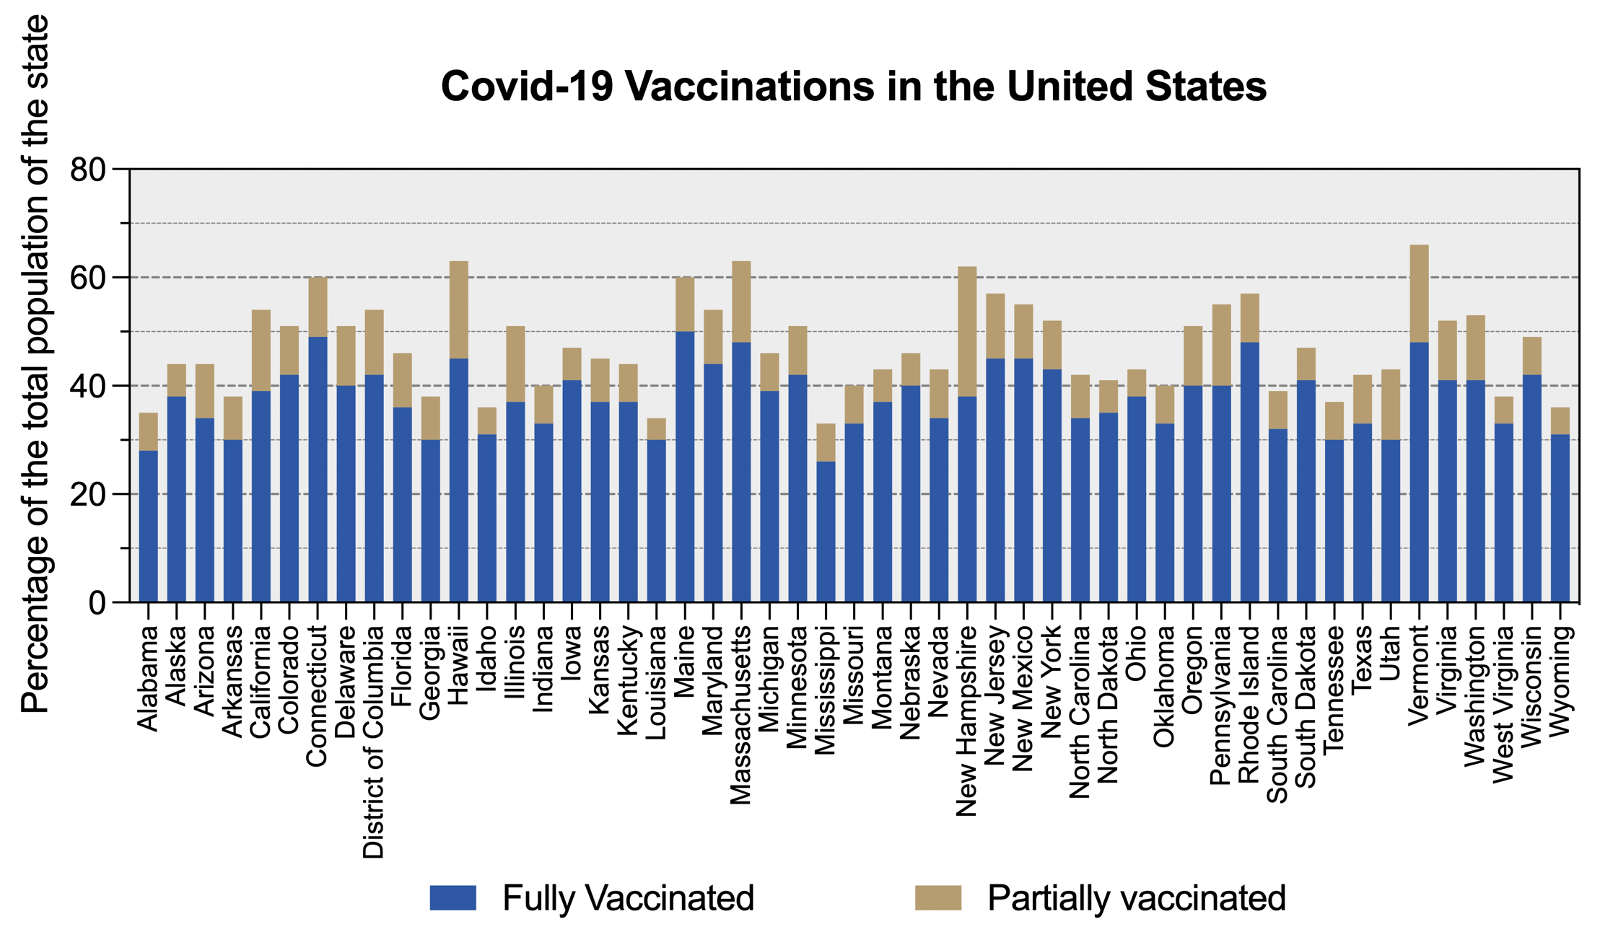
As indicated on the graph, this visualization represents the population of each state. The Y axis title is presented in the "standard" orientation and position, and - because the Y axis title is relatively short - this graph looks reasonably good. However, look at the following graph with a slightly longer Y axis title:

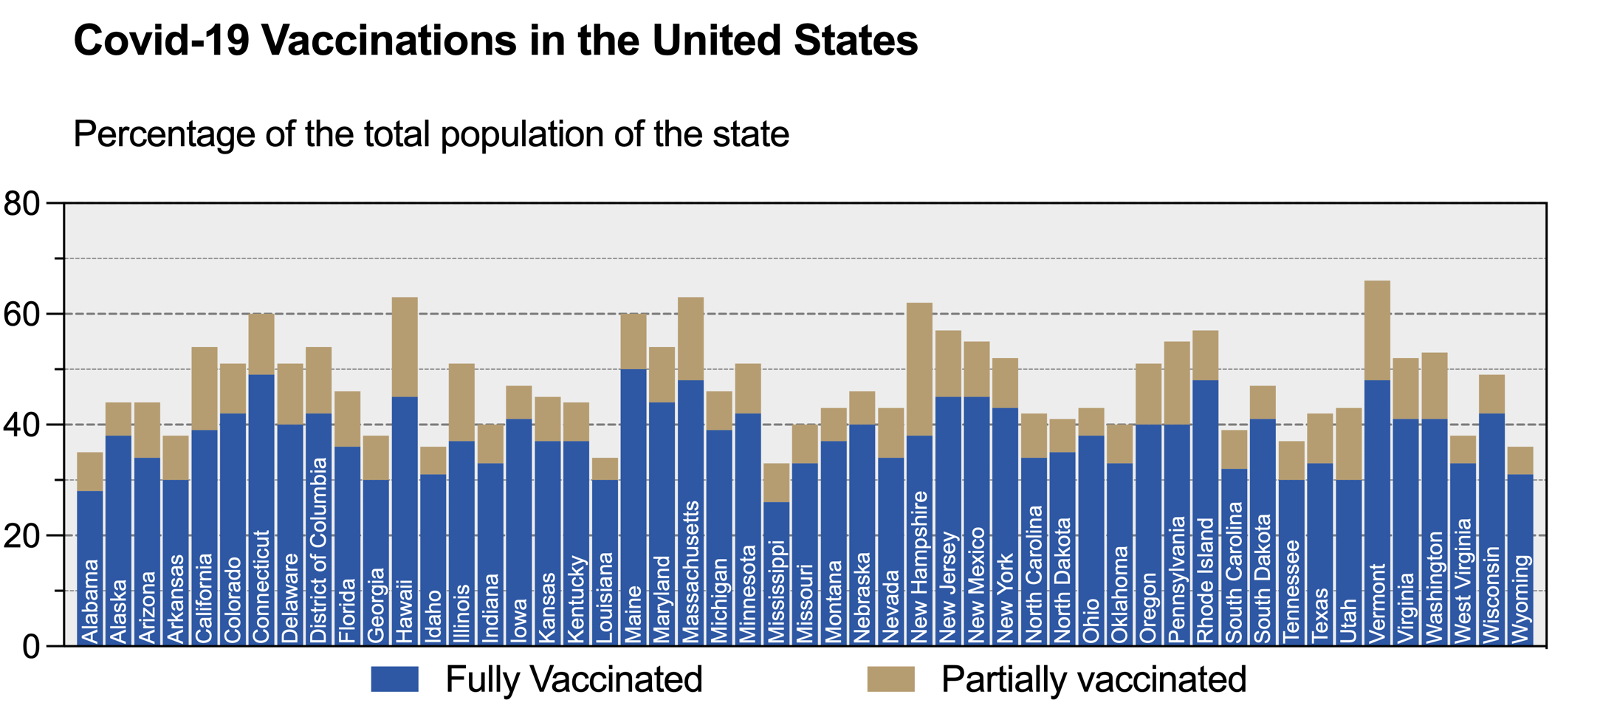
In this case, the "standard" position of the Y axis title no longer looks quite as good. One option to address this may be to change the font size of the axis title, or to break the title into multiple lines of text. However, an alternative solution may be to change the rotation and location of the Y axis title. Instead of including the axis title on the left side of the axis, you could choose to place it above the Y axis title, and - to account for its new location - change its rotation to horizontal text. The graph below shows what this might look like (note that the Graph title has also been aligned with the Y axis title, and the X axis labels have been moved above the axis):

Prism 9.2.0 introduces a new set of controls to specify both the rotation and location of the Y axis titles (with separate controls for left and right Y axes when appropriate). By default, the rotation of the Y axis title text will be assigned automatically (vertical or horizontal, depending on its location), but you can also choose to specify this rotation manually. These controls can be found in the Titles & Fonts tab of the Format Axes dialog, and allow for the Y axis to be specified as:
Rotation:

Location:


Fill Colors from Color Schemes (that work!)
Many different types of visualizations can be used to summarize sets (groups) of data, including bars, box-and-whiskers, violins, and more. These visualizations provide an easy way to represent one or more summary statistics for the underlying data. Examples of these summary statistics include the sample standard deviation, the sample mean and its standard error or confidence interval, the median and quartiles of the data, and others. However, in many cases when the amount of data is reasonable, it's a good idea to also include individual symbols for the data points contained within the set or group. Prism offers many such options for overlaying symbols for individual data points along with summary visualizations, including:

In previous versions of Prism, using pre-defined color schemes with any of these visualizations led to some unexpected results. Specifically, these visualizations would ignore the "Fill color" assignment of these color schemes, leaving the interior of the summary visualization objects (bars, boxes, violins) completely transparent. This is what these graphs might look like after applying the Colorblind Safe color scheme in earlier versions of Prism:
Color schemes applied to graphs prior to Prism 9.2

The reasoning for this was that if the fill color was the same as the color applied to the symbols, the symbols would be obscured. This would defeat the purpose of displaying all of the data in the first place! However, many built-in color schemes (and user-defined color schemes) include defined fill colors, and we want to ensure that these fill colors are recognized and used. Thus, in Prism 9.2.0, we've improved the way that fill color is added to these graphs. Now, Prism will use the defined fill color for the selected color scheme, but will apply it at 50% transparency so that the symbols (or quartile lines, etc.) can still be seen. The result is much more colorful graphs that still convey all of the most useful information about the data:

Updates to the Graph Portfolio
Prism 9.2.0 provides some visual updates for many of the example graphs that can be found in the Graph Portfolio. Many of these graphs have been updated to include new Y axis title positions, new color schemes (including some of our semi-transparent color schemes), and have just been generally improved visually. Check out the Graph Portfolio from the Welcome Dialog to explore examples of many of the different types of graphs that Prism can generate!
Complete Release Notes for Prism 9.2.0
New features
- Search bar in the Analyze Data dialog allowing for easy identification of desired analysis
- Reorganization of the Analyze Data dialog to reflect standard workflow
- Unification of Analyze Data dialog and Create New Analysis dialog
- Recently Used analysis folder moved to the top of the analysis list in the Analyze Data dialog
- New location and rotation controls for Y axis titles in the Format Axes dialog, and corresponding settings in the Prism preferences
- Improved snapping behavior of axis titles
Feature improvements
- Renamed the item "Label Direction" to "Label Location" in the contextual menu for axis numbers/labels
- Changed the dropdown menu title from "Direction" to "Rotation" for axis titles in the Titles & Fonts tab of the Format Axes dialog
- Changed the graph previews on the button in the Residuals tabs of the t test and One-way ANOVA dialogs to a (monochrome) two-color heatmap
- Improved performance of Nested one-way ANOVA when analyzing data with a large number of rows
- (Win) Made it possible to perform one-way ANOVA using a mixed-effects model with data containing a large number of rows
- (Win) Enabled symbol formatting (color, shape, size) commands in the contextual menu invoked for data points on the "Scatter plot with bar" graph from the "Column" graph family
- (Win) Enabled the 'Show additional ticks' section in the 'Format Axes' dialog for graphs created from a data table with dates/times in the X column
- (Win) Enabled the "Make these choices the default for future fits" checkbox for the "Show SE of parameters" option in the "Confidence" tab of the nonlinear regression analysis parameters dialog
- (Mac) Removed "Hold shift and click to draw a series..." from the tooltip for the toolbar button for the lines-with-text drawing object
Analysis bugs fixed
- Fixed the issue in which nonlinear regression analyses failed to produce results for some user-defined equations (read more)
- Fixed the issue in which X values unexpectedly disappeared in Normalize results if the last X values had missing y values in the source data table
- Fixed the issue in which values of lower and upper confidence limits were incorrectly swapped in the Hook Constant dialog for the Contingency Chi-square analysis
- Fixed the issue in which Prism would freeze on un-checking the Three-way interactions checkbox in the Model tab of the re-opened Parameters: Multiple Linear Regression dialog after adding a huge number of variables in the data table
- Fixed the issue in which Multiple linear and Multiple logistic regression results appeared empty after excluding the dependent (outcome) variable in the source data table
- Improved behavior of older versions of Prism when recalculating results for One-way ANOVA when more than 256 datasets are included in the analysis. Earlier versions of Prism that do not support this size of data will now display blank results upon attempting to recalculate the analysis
- Fixed the issue in which Prism would report incorrect results for mixed models with missing data (REML calculations) containing more than one random factor (read more)
- Improved Prism's response time when canceling the calculation of Nested t test analyses when the data being analyzed contains a large number of rows
- (Win) Fixed the issue in which the "Recalculate automatic reference levels" box unexpectedly appeared unchecked in the Reference tab of the Parameters: Multiple Linear Regression dialog after the analysis was performed without visiting this tab
- (Win) Fixed the issue in which Prism 8 would crash when switching between tabs in the 'Parameters: Multiple Linear Regression' dialog while using a Prism project created using Prism 9
- (Win) Fixed the issue in which it was impossible to simulate data from an info, graph, or layout sheet if a project did not contain any data tables or green results sheets
- (Win) Fixed the issue in which the 'Disk or memory error occurred' alert appeared instead of the 'There are too many rows or columns...' floating note when attempting to perform RM three-way ANOVA from tables with a large amount of data
- (Win) Fixed the issue in which an analysis constant from the parent family appeared replaced with a new analysis constant from the duplicated family (and vice versa) that produced misleading results
- (Mac) Fixed the issue in which the empty "Choose dependent...variable" dropdown menu unexpectedly appeared in the Parameters: Multiple Logistic Regression dialog
- (Mac) Fixed the issue in which Prism would freeze in an attempt to switch to the Interpolation tab of the Parameters: Multiple Linear Regression dialog after all components were unchecked on the Model tab
- (Mac) Fixed the issue in which it was impossible to select rows by levels within the Select and Transform analysis for a categorical variable if there was an empty adjacent variable to the left in the data table
- (Mac) Fixed the issue in which it was impossible to select rows by levels within the Select and Transform analysis for a categorical variable if some of the variables were unchecked in the Analyze Data dialog
- (Mac) Fixed the issue in which it was unexpectedly possible to select analyses that were disabled in the "Which analysis?" section of the Analyze Data dialog invoked for red results sheets
- (Mac) Fixed the issue in which levels for a different categorical variable were unexpectedly shown in the Select categories sub-dialog of the Select and Transform analysis if some of the variables were unchecked in the Analyze Data dialog
- (Mac) Fixed the issue in which fractional and negative K parameter values were incorrectly handled in the 'Round(X,K)' and 'Round(Y,K)' standard transformations
Graphing bugs fixed
- Fixed the issue in which Prism would crash upon opening a file with an analysis-generated grouped bar graph containing a separating line and frozen results sheet
- Fixed the 'Apply formatting applied to individual points or bars' option in the 'Magic' dialog so that it will work for grouped scatter graphs
- Fixed the issue in which fill color was unexpectedly not set to bars, violins, floating bars, or box-and-whiskers on graphs with individual data points upon selecting color schemes
- Fixed the issue in which Prism would crash upon opening a Prism file with a frozen, analysis-generated grouped bar graph containing a separating line
- Fixed the issue in which an incorrect color was set to a bar after applying a semi-transparent color to a stacked bar graph in which the source data contained values of zero in the table
- (Win) Fixed the issue in which the left Y axis title did not appear on a graph after turning it on in the 'Titles & Fonts' tab of the 'Format Axes' dialog
- (Win) Fixed the issue in which the 'Frame and Origin' tab was not selected by default in the 'Format Axes' dialog after double-clicking on the graph origin
- (Mac) Fixed the issue in which the mean and median on a graph were incorrectly updated upon changing data in the source data table
- (Mac) [macOS 1014, 10.15, 11.0 (Big Sur)] Fixed the rendering issue in which gray margins unexpectedly appeared around a graph or layout page when increasing the zoom with enabled rulers
- (Mac) Fixed the issue in which annotations were not shown for bar graphs when bars had zero height
Other bugs fixed
- Fixed the issue in which frozen green results sheets appeared blank or empty with Y columns after saving a document
- (Win) Updated the hint near the 'Export text as Text' option in the Export dialog to 'Non-Latin and special characters will be corrupted' for 'EPS' file format
- (Win) [Japanese version] Changed the default options to export text as 'outlines' for EPS file format
- (Mac) Fixed the issue in which analyses appeared disabled (gray), but could be selected in the "Create New Analysis" dialog for duplicated results sheets
- (Mac) Fixed the issue in which the "Analyze which data sets?" section appeared instead of "Analyze which variables?" in the Analyze Data dialog invoked for Multiple Variables data tables
- (Mac) [macOS 11.0 (Big Sur)] Fixed the issue in which the incorrect version was assigned to the info constant "Last saved by Prism version" in the "Hook Constant" dialog for files crated in earlier Prism versions
- (Mac) Fixed the issue in which the Delete command did not work for duplicated graphs or layout sheets in the Navigator
- (Mac) Fixed the issue in which the Space bar on the keyboard did not work to select data sets in the "Analyze which data sets?" section of the "Analyze Data" dialog
- (Mac) Fixed the issue in which it was impossible to open PZF files with long row titles in data tables created in older versions of Prism
- (Mac) [macOS 11.0 (Big Sur)] Fixed the issue in which the 'Delete' (x) button was not shown for autocomplete lists in a data table
- (Mac) Fixed the issue in which Prism would crash when selecting the 'Parts of Whole' graph family in the 'Change Graph Type' dialog for scatter graphs while 0% was set for 'Blank/missing cells' spacing and data sets contained empty cells
- (Mac) Fixed the issue in which changing the justification of variable titles in a multiple variable data table unexpectedly altered the justification of the X axis title on the linked graph
- (Mac) Fixed the issue in which Shift, Command, Space modifier keys did not work for shortcut combinations to select data sets in the 'Analyze which data sets?' section of the 'Analyze Data' dialog
Analyze, graph and present your scientific work easily with GraphPad Prism. No coding required.
