- Prism
FEATURES
Analyze, graph and present your workComprehensive analysis and statisticsElegant graphing and visualizationsShare, view and discuss your projectsLatest product features and releasesPOPULAR USE CASES
- Enterprise
- Resources
- Support
- Pricing
Prism 9.4.0 Release Notes
Prism 9.4.0 was released on June 08, 2022.
Pairwise Comparisons for Multiple t Tests
You've been asking, we've been listening

One of the most popular features released in Prism 9 was the "Pairwise Comparisons" feature that introduced the ability to automatically add the results of multiple comparisons tests onto the graphs of the analyzed data. In Prism 9.4, we've expanded the analyses that can be used with this feature to include the Multiple t tests (and nonparametric tests) analysis. This analysis will perform a separate test (unpaired or paired, parametric or nonparametric) for each row of the data table, and offers a number of different techniques to adjust the statistical results to account for the total number of tests being performed.
After performing this analysis, a single click of a button will allow you to automatically plot these results directly onto your graph!

New controls for Pairwise Comparisons
Your favorite feature, now with more customization and flexibility
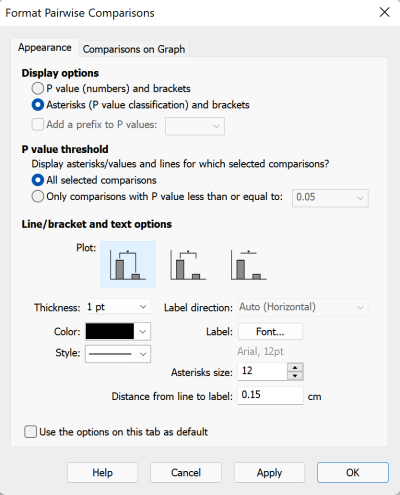
After the initial release of the "Pairwise Comparisons" feature, we got a lot of feedback about things that could be improved with this feature. And we've delivered on a lot of these requests. The Format Pairwise Comparisons dialog has been updated and improved to make it easier to get the visual representation of your analysis results that you want, and to customize its appearance even more.
P value prefixes
When adding Pairwise Comparisons, one of the first choices to make is whether to show numeric P values or the associated P value summaries ("ns" or asterisks that categorize the numeric P values). Choosing to display numeric P values is often more informative that simply including the corresponding summaries. However, simply adding the appropriate number above the bracket on the graph wasn't always very visually appealing. As a result, we added the option to include prefixes in the bracket labels when displaying numeric P values. You can choose from the built-in "P =" or "p =" prefixes (depending on your style preference), or enter your own custom prefix. Note that Prism will be smart about how it handles the equals sign at the end of a prefix. If the prefix is "P =" (for example), and the numeric P value is reported as "<0.0001", Prism will automatically drop the equals sign so that the bracket label is displayed as "P < 0.0001"
Clear bracket style options
In previous versions of Prism, the three bracket styles offered in the Pairwise Comparisons dialog were displayed in a dropdown menu, and not easy to identify. We've replaced this dropdown menu with tiles that clearly display the three different bracket styles to choose from
Separate Text and Asterisk Sizes
Do you want larger text labels and smaller asterisks? Larger asterisks and smaller text? The updated Pairwise Comparisons dialog allows you to specify the size of asterisks and text labels added to the graph independently.
Specify the Distance
Once you've got the text the size that you want it, there's still the question of how far that text should be placed from its associated bracket. Use the "Distance from line to label" controls to very precisely adjust this distance and fine-tune the final appearance of your graph.
Better Default Axes for Graphs with Bars
Making sure your graphs are clear and accurate

For better or worse, bar graphs are commonly used to summarize groups of data. In general, we always recommend showing the underlying data (individual data points) when it's possible as this provides a much better depiction of how the data are distributed compared to a bar that only displays the mean or median of the underlying data. However, any time bars are used on a graph, it's a good idea to make sure that the baseline for the bars is zero. This ensures that the height of the bar is proportionate to the value that it represents (the mean or median of the underlying data).
In previous versions of Prism, the default appearance for the "Scatter plot with bar" graph type didn't rely on this rule of setting the bar baseline to zero. Thus, while the scatter plot did a good job of displaying the distribution of the data, comparing the height of the bars may have been misleading. Other graph types (like the standard Column bar graph) did default to displaying the bars with a baseline of zero. In Prism 9.4, we've updated the default way that we plot all graphs with bars to ensure that the axis range for these graphs always includes zero (you're still able to customize the baseline or scale of the axis for bar graphs, but we think that having a zero baseline by default is the right choice).
Complete Release Notes for Prism 9.4.0
New Features
- Automatic Pairwise Comparisons on Graph now available for results of Multiple t tests (and nonparametric tests) analysis
- Multiple improvements made to the Format Pairwise Comparisons dialog
- Introduced the ability to include a prefix to numeric P values in pairwise comparisons added to a graph
- Allowed entering (0,1] as a P value threshold for pairwise comparisons on a graph
- Improved display of bracket styles for pairwise comparisons by replacing dropdown menu with tile buttons
- Introduced new controls for specifying asterisk symbol size independently from text size
- Introduced new controls for specifying the distance between a bracket/line and its associated label (asterisk or value)
- Improved the Pairwise Comparison toolbar button behavior: if all brackets have been removed/disabled on a graph, clicking the Pairwise Comparisons toolbar button will enable all pairwise comparisons for the graph
Feature Improvements
- Added the option to disable GLM-based initial value calculations for mixed models used in RM ANOVA analyses to increase the speed of calculations for large datasets
- Introduced "P value type" results sheet for correlation matrix results when calculating Spearman correlation coefficients. This sheet indicates which P values are exact and which are approximate (including when calculations are interrupted)
- Improved the yellow iteration progress windows by displaying percentage completion while performing Two-way ANOVA analysis with a mixed-effects model run on large data sets
- Improved equation syntax to allow negative exponents written in the form "x^-n"
- Improved the performance of the Repeated Measures One-way ANOVA analysis with the test for linear trend
- Disabled the "Test for trend" (Multiple comparisons tab) when performing One-way ANOVA if "No. Use the Geisser-Greenhouse correction." option was selected under "Assume sphericity" on the Experimental design tab of the analysis parameters dialog
- Changed the order of Normality tests in the Normality and Lognormality Tests analysis parameters dialog (D'Agostino-Pearson omnibus test now listed first)
- Revised the order of letters in the "Greek" tab of the "Insert Character" dialog
- Improved the performance of the "Nonlinear Regression" analysis by enabling multithreading for data preparation
- Improved the yellow hint box in the "Model" tab of the Parameters dialog for Two-way ordinary ANOVA with the multiple comparisons option "Compare each cell mean with the other cell mean in that row" selected
- Allowed applying colors without semi-transparency as fills for bars, violins, floating bars, and box-and-whiskers on graphs with individual data points using color schemes
- Updated the color scheme used by Prism when generating plots from the Cox Proportional Hazards Regression analysis if a categorical variable is selected in the "Symbol fill color" dropdown in the Options tab of the analysis dialog and Prism's default color scheme is set to "Black and white." In this scenario, Prism will now use the "Colors" color scheme
- Updated the LabArchives signup ("Try LabArchives") links
- (Win) Allowed entering values from (0,1] as P value thresholds for Pairwise Comparisons
- (Win) Improved the rendering performance of column graphs with individual values containing a large amount of data
- (Win) Enabled the Ctrl+Equal sign (=) shortcut (zoom in) while on a Multiple Variables data table with a single cell (except for row/column titles) selected
- (Mac) Implemented a common set of "default" values as P value thresholds for Pairwise Comparisons
- (Mac) Improved Prism's performance when running looped scripts (it is now several times faster)
- (Mac) Improved the appearance of the Analyze toolbar button (darker text now used)
Analysis Bugs Fixed
- Fixed the issue in which Prism did not report the Spearman Correlation matrix after interrupting the calculation by pressing the Escape button. Now, Prism reports approximate P values in this situation
- Fixed the issue in which the "Invalid equation" alert unexpectedly appeared in an attempt to create a user-defined equation that included a minus sign following another mathematical operator
- Fixed an inconsistency in the text of Narrative results after performing Two-way ordinary ANOVA without an interaction for data with replicates
- Fixed the issue in which incorrect data sets were used for calculating One-way and Nested ANOVA analyses with multiple comparisons if pairs of column means were selected beyond the 256th column
- Fixed the issue in which progress feedback for Two-way ANOVA using a mixed model appeared stuck while performing the calculation on large data sets
- Disabled the "Test for trend" option in the Multiple Comparisons tab of the One-way ANOVA analysis parameters dialog if "Assume sphericity" was set to "No" in the Experimental design tab of the dialog
- Fixed the issue in which data was not transformed by the Transform analysis if there were blank values in the first column of the input data table
- (Mac) Fixed the issue in which the 4PL "inhibitor vs response" model did not compute profile likelihood confidence intervals for input data that had been transformed using the log(X) transformation
Graphing Bugs Fixed
- Fixed the issue in which graph titles moved by arrow keys unexpectedly shifted upward after re-opening the Prism project
- Fixed the issue in which axes did not start at 0.0 on scatter plots with bars
- Fixed the issue in which gaps unexpectedly appeared on "Stacked bar" graph if negative and missing values were present in the source data sets
- Fixed the issue in which separated bar graphs appeared corrupted when data sets in source data table had blank or excluded cells and the spacing for "blank/empty" values was set to 0% in the "Format Graph" dialog
- Fixed the issue in which vertical axis labels of nested bar graphs placed on layouts appeared truncated
- Fixed the issue in which multiple individual points were displayed as one for Nested Scatter graphs if the data table had fewer rows than subcolumns
- (Win) Fixed the issue when colors applied to non-filled symbols on Column and Grouped graphs were lost after changing the symbol shape
- (Win) Fixed the issue in which the color of symbol borders on a violin plot with points was incorrectly applied to the whole data set instead of selected cells
- (Win) Fixed the issue in which asterisks on pairwise comparisons and zig-zag lines became misaligned on a graph exported from Prism
- (Win) Fixed the issue in which it was impossible to format points for any subcolumn in the data set other than the first and last subcolumn on "Scatter with bar" graphs in the Nested family of graphs
- (Win) Fixed the issue in which it was impossible to format points for "Scatter with bar" graphs in the Nested family of graphs if the data had only one row
- (Win) Fixed the issue in which it was impossible to move or resize pairwise comparisons and zig-zag lines on a graph while holding the Alt modifier key to turn off snapping
- (Win) Fixed the issue in which some Math symbols in a text object on a graph were rendered incorrectly after exiting text edit mode
- (Win) Fixed the issue in which pairwise comparisons did not appear on a graph which was cloned from another project
- (Win) Fixed the issue in which it was possible to rotate multiple selected P values/asterisks of pairwise comparison lines via the toolbar buttons
- (Win) Fixed the issue in which non-transparent bars unexpectedly appeared on the Scree plot generated by PCA in an attempt to format the graph using the Format Graph dialog
- (Win) Fixed the issue in which 90-degree joins (i.e. corners) of drawn shapes (bars, rectangles, etc.) unexpectedly appeared rounded when exporting to PDF
- (Mac) Fixed the issue in which the Y-axis title unexpectedly moved upward while attempting to move it using the arrow keys of the keyboard
- (Mac) Fixed the issue in which the Y-axis title was unexpectedly misplaced while attempting to customize its position if the graph was set to fit to the page
- (Mac) Fixed the issue in which the Y-axis title was slightly displaced upwards each time the title text was bolded and un-bolded
- (Mac) Fixed the issue in which the custom position of the comparison lines on a graph were not reset to default after changing the scale of the left Y-axis
- (Mac) Fixed the issue in which the vertical Y axis title was unexpectedly displaced after applying formatting
- (Mac) Fixed the issue in which a data table embedded on a graph sheet became smaller and lower resolution after performing the "Freeze" action
- (Mac) Fixed the issue in which bars on a Scree Plot generated by PCA remained invisible after changing their attributes in the Format Graph dialog
Other Bugs Fixed
- Fixed the issue in which Prism would crash upon performing PCA when the default color scheme applied to the analysis-generated graphs did not contain a repeated pattern for all data sets
- (Win) Fixed the issue in which Prism would crash while selecting the "P values less than or equal to" option or by deselecting displayed comparisons in the "Format Pairwise Comparisons" dialog while there were too many comparisons to be displayed on the page
- (Win) Fixed the issue in which Prism would occasionally crash while performing multithreading activities when the mouse is left hovering over objects in the Navigator or data points on a graph created from a source data table containing a huge amount of data
- (Win) Fixed the issue in which Prism would crash while adding text to a heatmap that was rotated to landscape and resized to fill the page
- (Win) Fixed the issue in which Prism would crash upon opening files containing resized Multiple Variables graphs with a categorical variable assigned to symbol Color when the default color scheme did not contain a repeated pattern
- (Win) Fixed the issue in which Prism would crash upon selecting the "P values less than or equal to" option in the "Format Pairwise Comparisons" dialog when comparison lines did not fit onto the page
- (Win) Fixed the issue in which Prism would crash upon clicking the "Apply" or "OK" buttons in the "Format Pairwise Comparisons" dialog after entering a very small P value when comparisons were turned off in the "Comparisons on Graph" tab
- (Win) Fixed the issue in which Prism would crash when attempting to perform the "Duplicate Family" command for a layout sheet that contained a graph from another project
- (Win) Fixed the issue in which the font style of labeling and numbering on a Prism graph copied to Microsoft PowerPoint became unexpectedly amended after opening the PowerPoint file on a Mac
- (Win) Fixed the issue in which non-Latin characters included in the error string passed from the server to Prism's "License Validation Error" alert appeared corrupted
- (Win) Fixed the issue in which the parent sheet in the Navigator was unexpectedly renamed in an attempt to rename a child sheet if both sheets had the same name
- (Win) Fixed the issue in which installation of MS Edge WebView2 Runtime unexpectedly began during Prism installation while the newest version of WebVew was previously installed
- (Win) Fixed the issue in which data exported into the CSV file format using the "wrow" script command was shown as space-delimited instead of comma-delimited
- (Windows) Fixed the issue in which the Prism script command "OpenOutput" ignored the Delimiter parameter and thus did not allow creating a CSV file
- (Win) Fixed the rendering issue of the text input field in the parameters dialog for "Area Under Curve"
- (Win) [Chinese] Updated the text in the "License Validation Error" alert to be displayed in Chinese
- (Mac) [macOS 12 Monterey] Fixed the issue in which Prism would crash while attempting to close an autosaved project
- (Mac) [macOS 12 Monterey] Fixed the issue in which column titles appeared corrupted in dialogs such as the Format Data Table, Select and Transform, Multiple Linear Regression, etc. dialogs
- (Mac) Fixed the issue in which the alert "This document could not be autosaved" unexpectedly appeared while attempting to Undo a series of actions related to Multiple Logistic Regression
- (Mac) Fixed the issue in which the icon with a question mark before "Learn about this equation" appeared corrupted in the "Parameters: Nonlinear Regression" dialog
- (Mac) Fixed the issue in which the "Purchase Upgrade" button appeared instead of the "Install Update" button in the Software Update dialog after trying to update Prism in Viewer mode while a major update is available
- (Mac) Disabled the "Try" button in the LabArchives dialog if the <try-account-blurb> tag is present in the prism-config.xml file
Analyze, graph and present your scientific work easily with GraphPad Prism. No coding required.