- Prism
FEATURES
Analyze, graph and present your workComprehensive analysis and statisticsElegant graphing and visualizationsShare, view and discuss your projectsLatest product features and releasesPOPULAR USE CASES
- Enterprise
- Resources
- Support
- Pricing
Prism 9.5.0 Release Notes
Prism 9.5.0 was released on December 07, 2022.
Add a splash of color
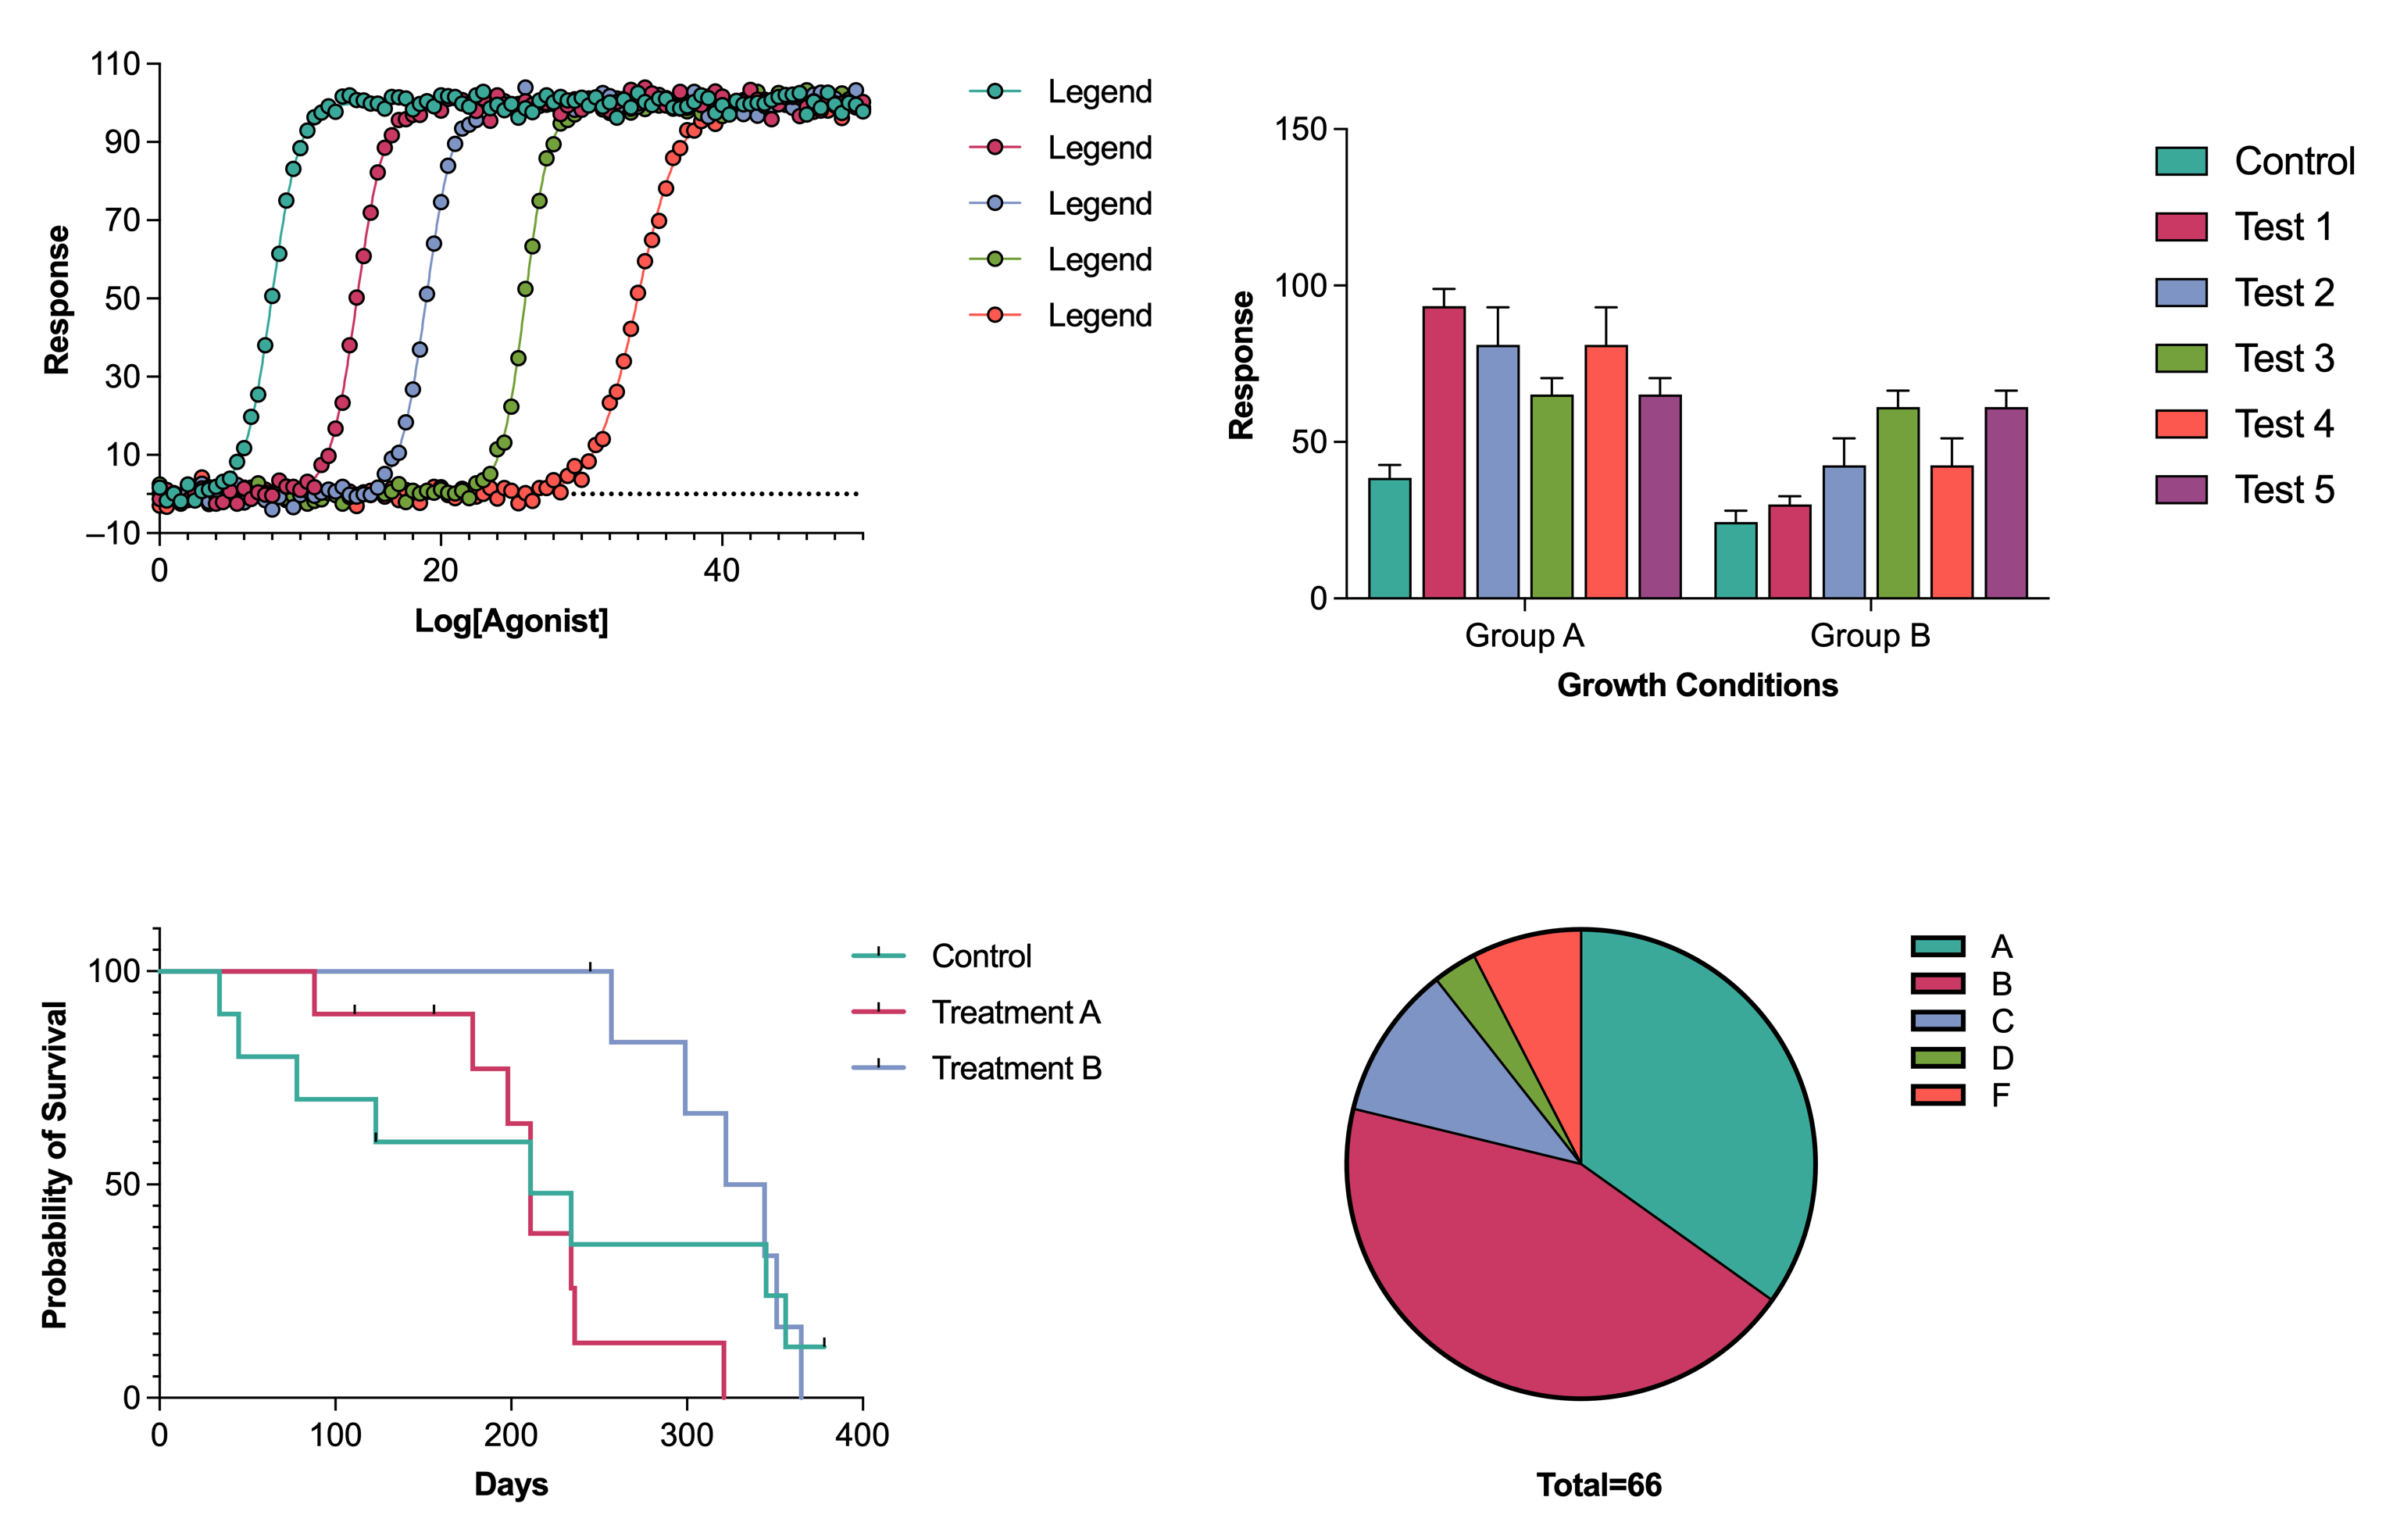
We know that creating the perfect visualization is important. You’ve already gone through all the work of generating and analyzing your data, the last thing you want is an uninteresting looking graph. Adding a bit of color is always a great way to highlight your work so we’ve added nine new built-in color schemes that you can choose from to get the look of your graph just the way you want it.
Improving accessibility
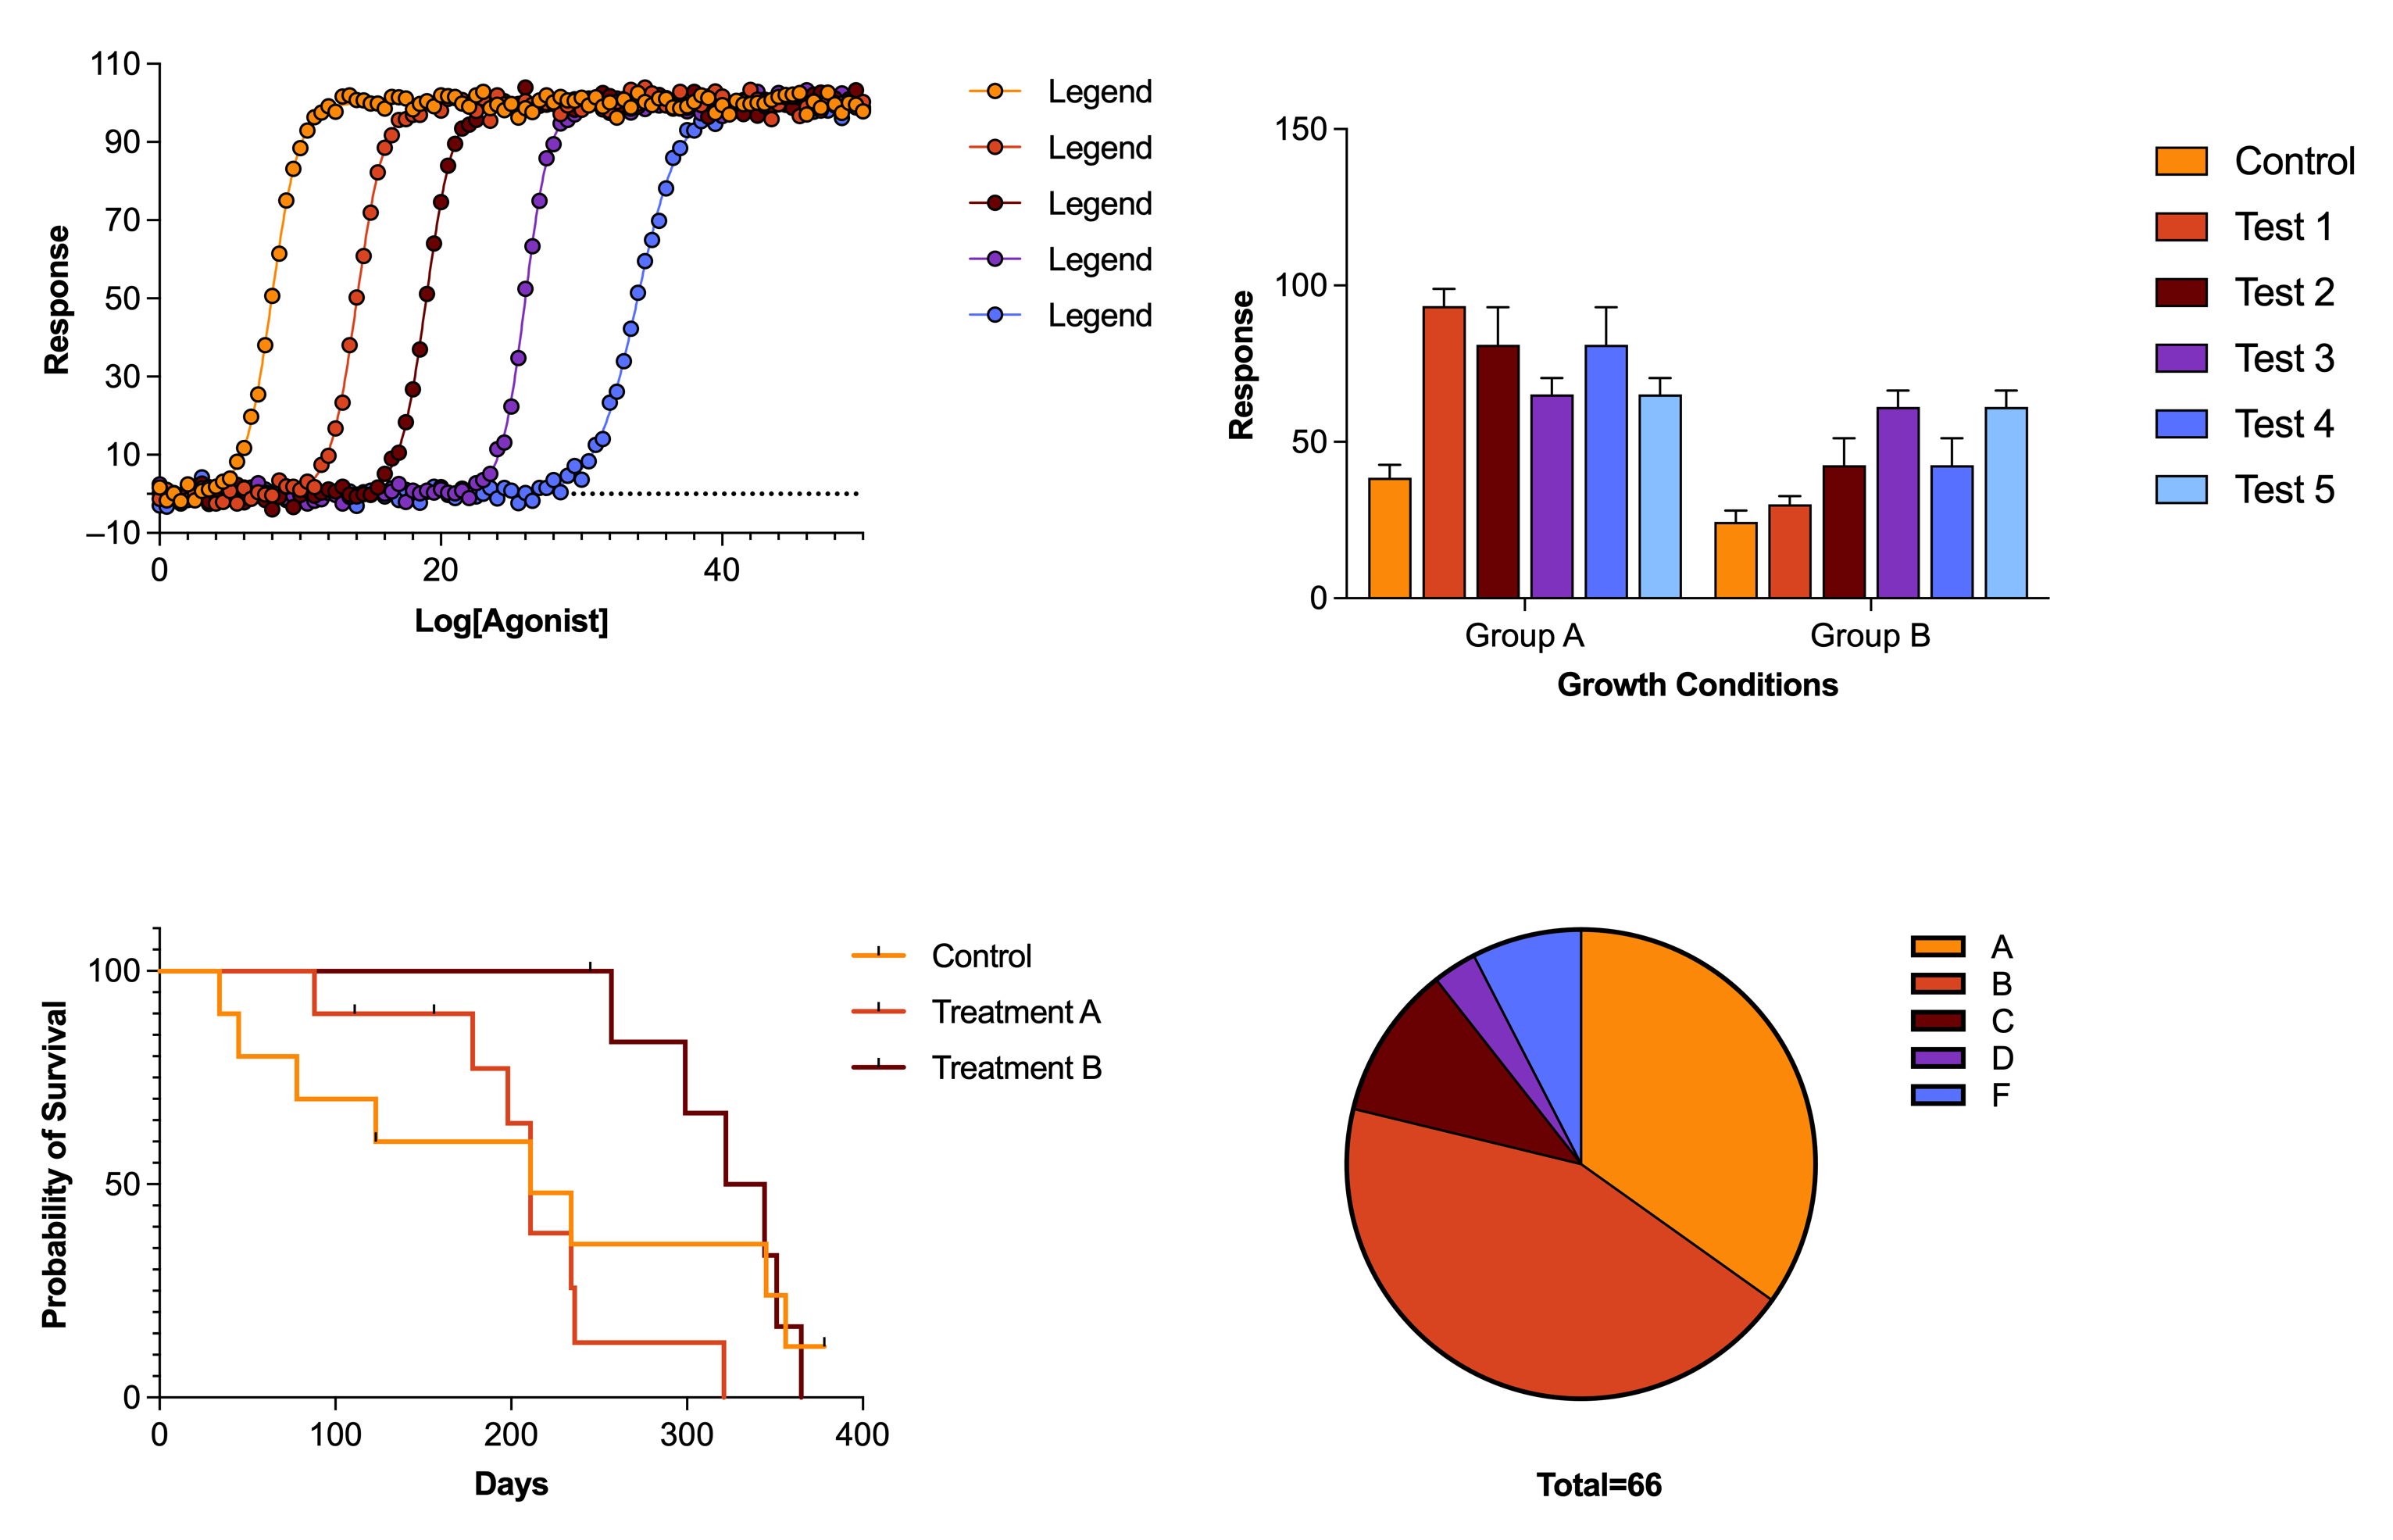
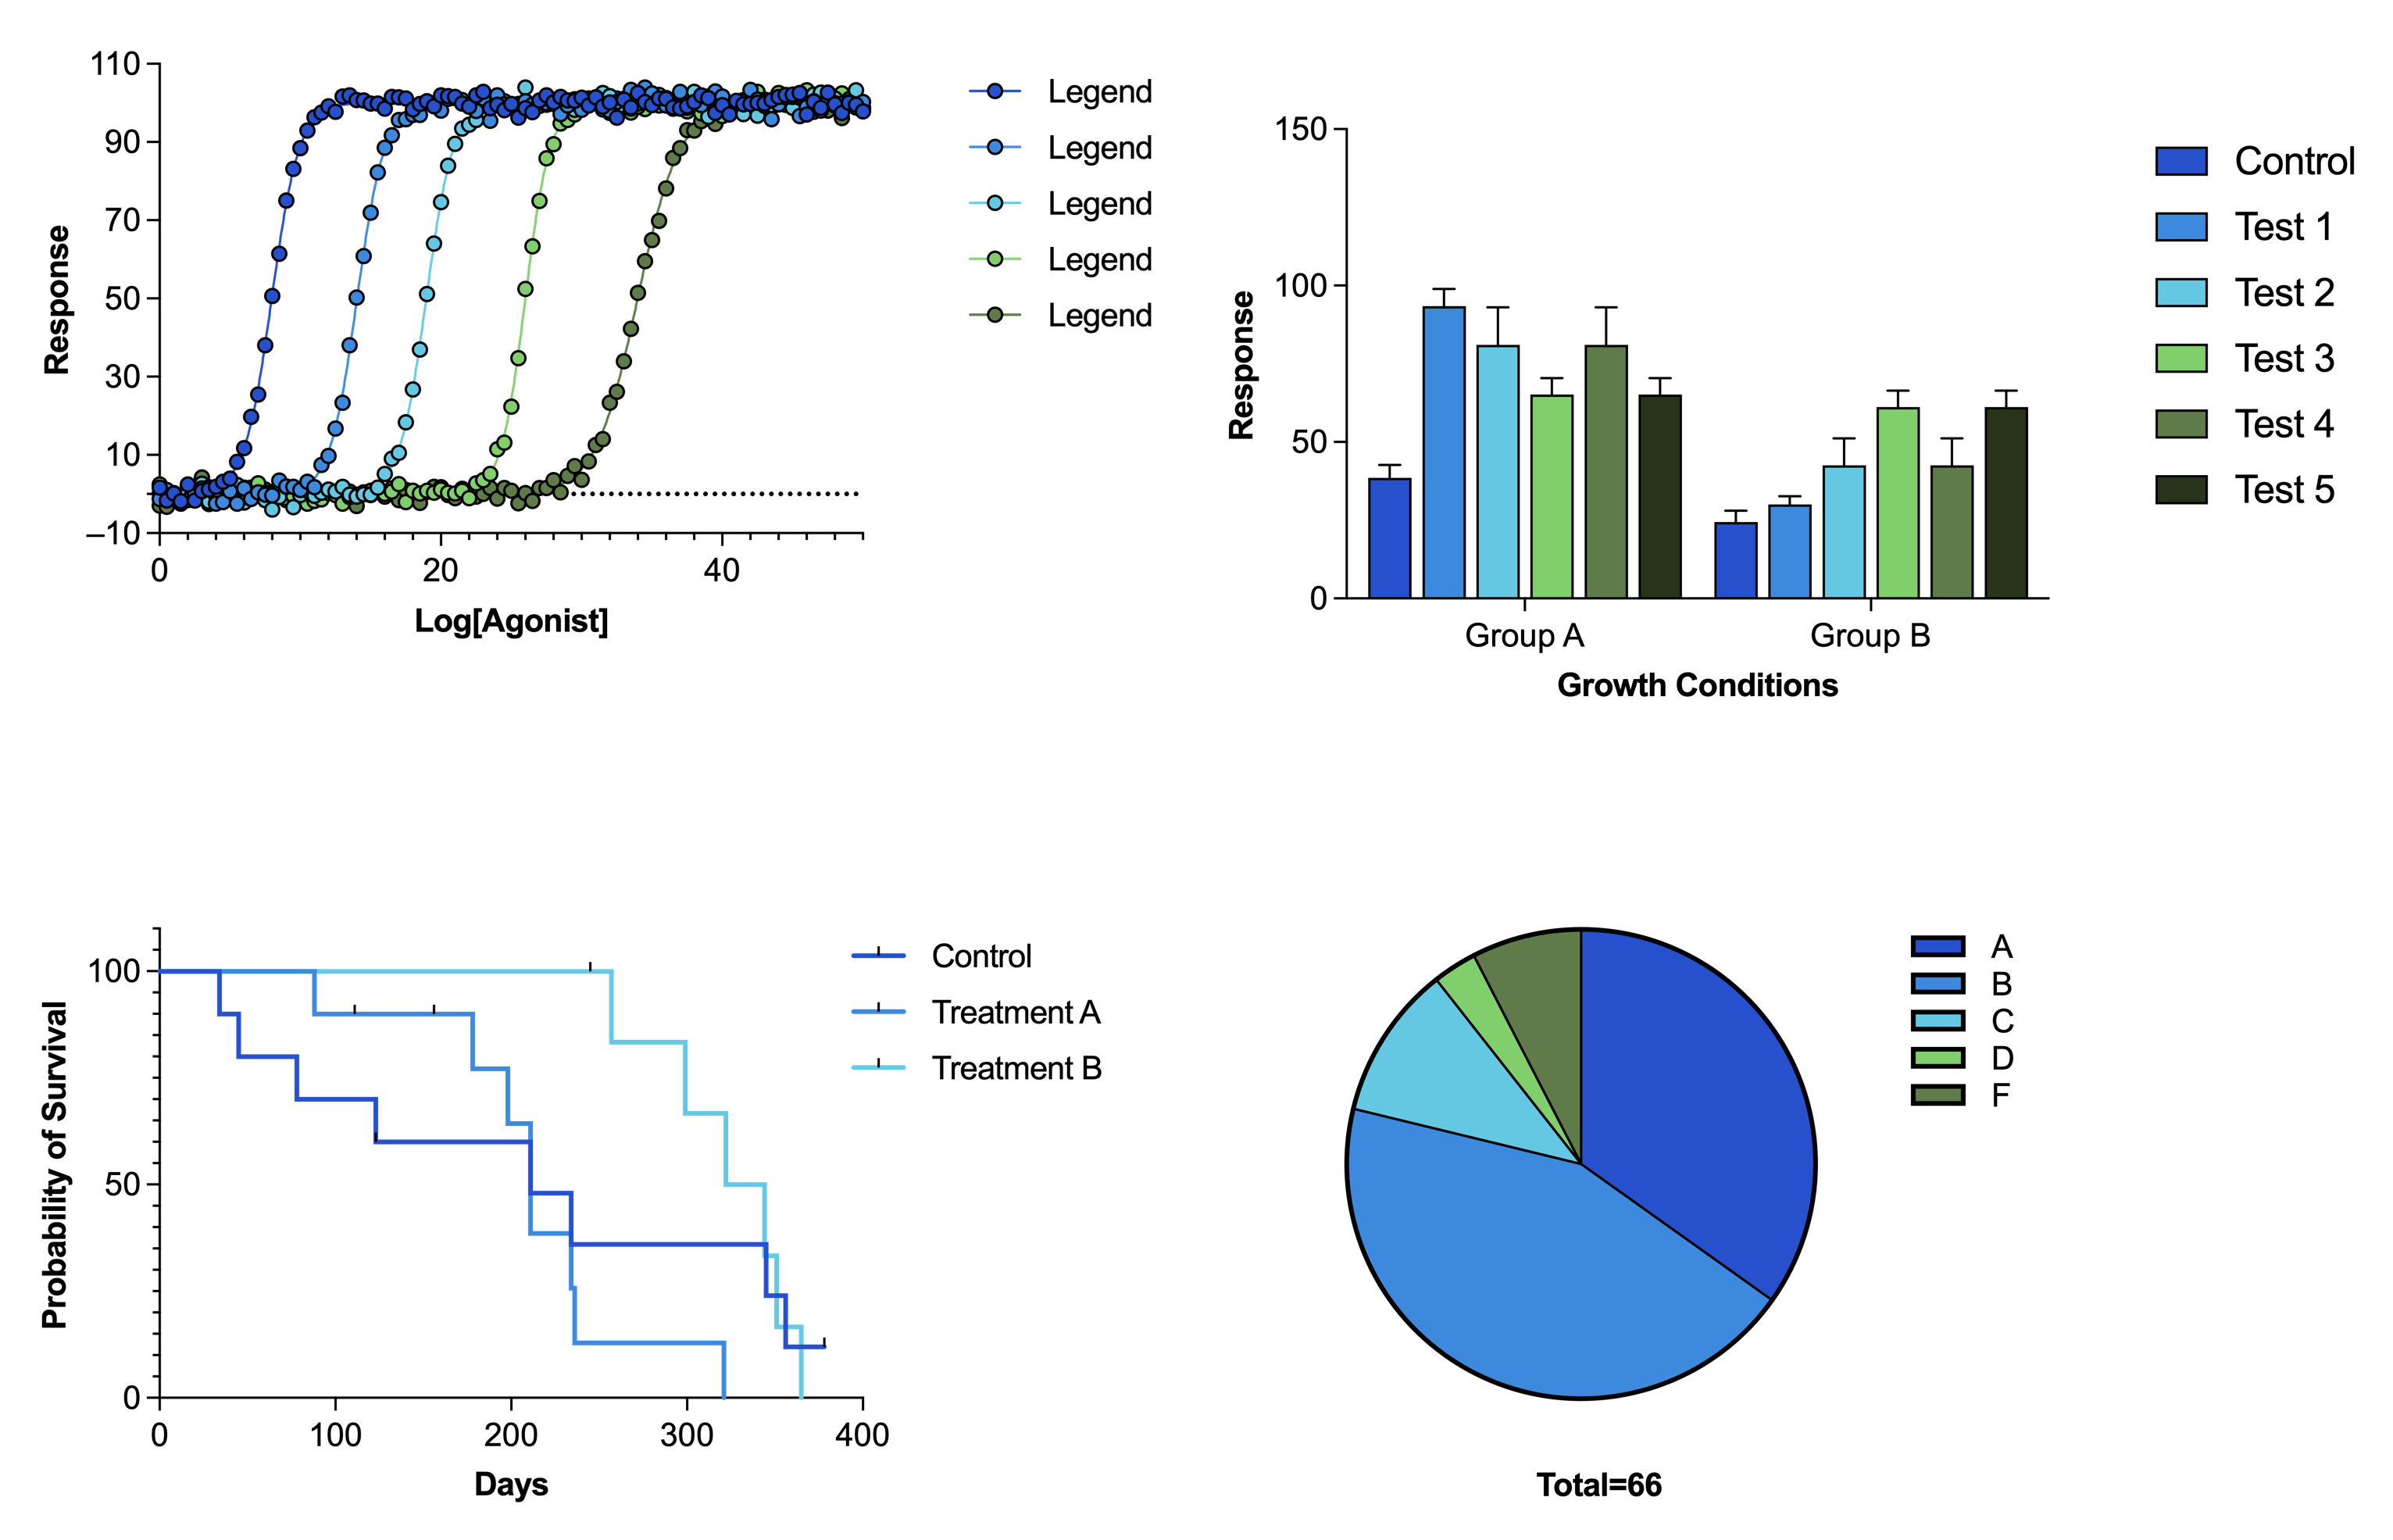
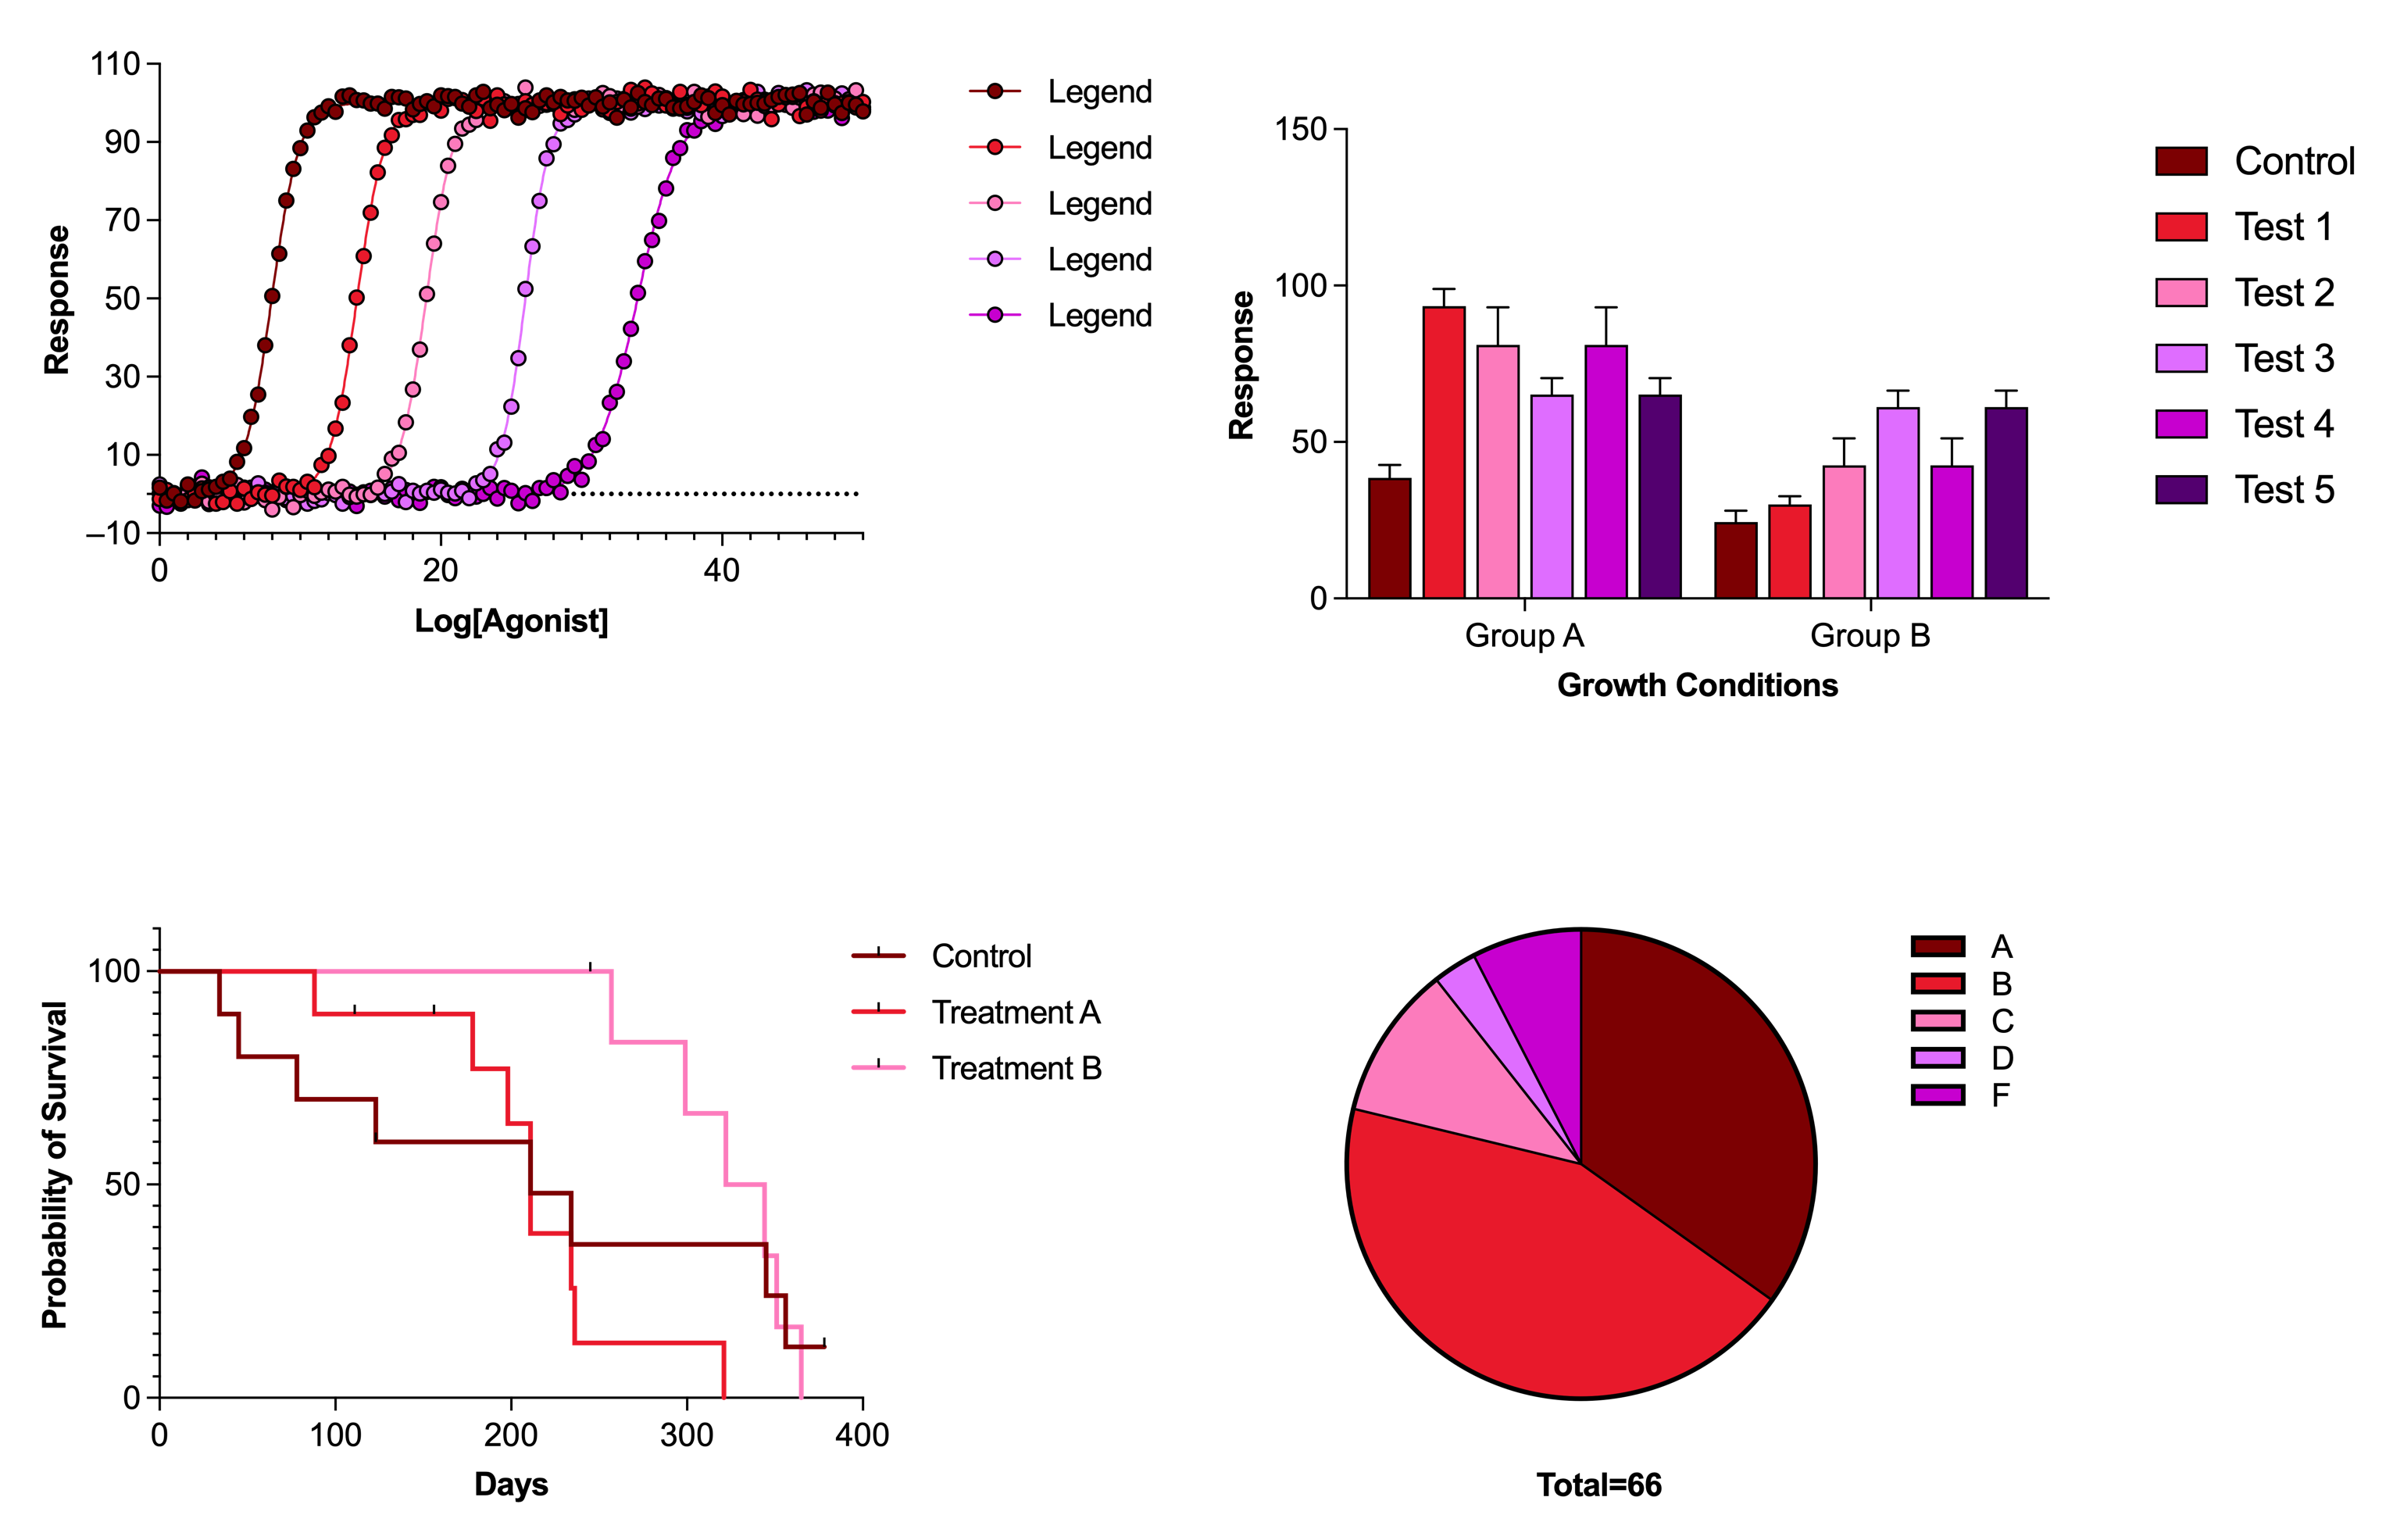
The first three color schemes added to Prism 9.5 are all aimed at ensuring that color differences can be perceived by anyone. Color blindness (color vision deficiency) makes it difficult or impossible to perceive the difference between certain hues. In a previous release, we introduced a single “Colorblind safe” color scheme that relied on hues that should be distinguishable by individuals with various forms of color vision deficiency. In Prism 9.5, we’ve introduced three more “Colorblind safe” color schemes that should accomplish this same objective, while providing for a bit of variety in your graph creation. NOTE: The use of transparency should be avoided when using these color schemes! Adjusting the level of transparency in some of these colors (done by default for some graph types in Prism) can cause some colors to be difficult to distinguish. If using these color schemes, ensure that the colors are set to a 0% transparency (or 100% opacity). Learn more.
Colorblind Safe 2: Sunset
Colorblind Safe 3: Lakeside
Colorblind Safe 4: Valentines
Decades of color - a visual trip through time
The other six color schemes we added in Prism 9.5 each represent color themes inspired by different periods of history.
1960s: an era of peace, love, and the Beatles
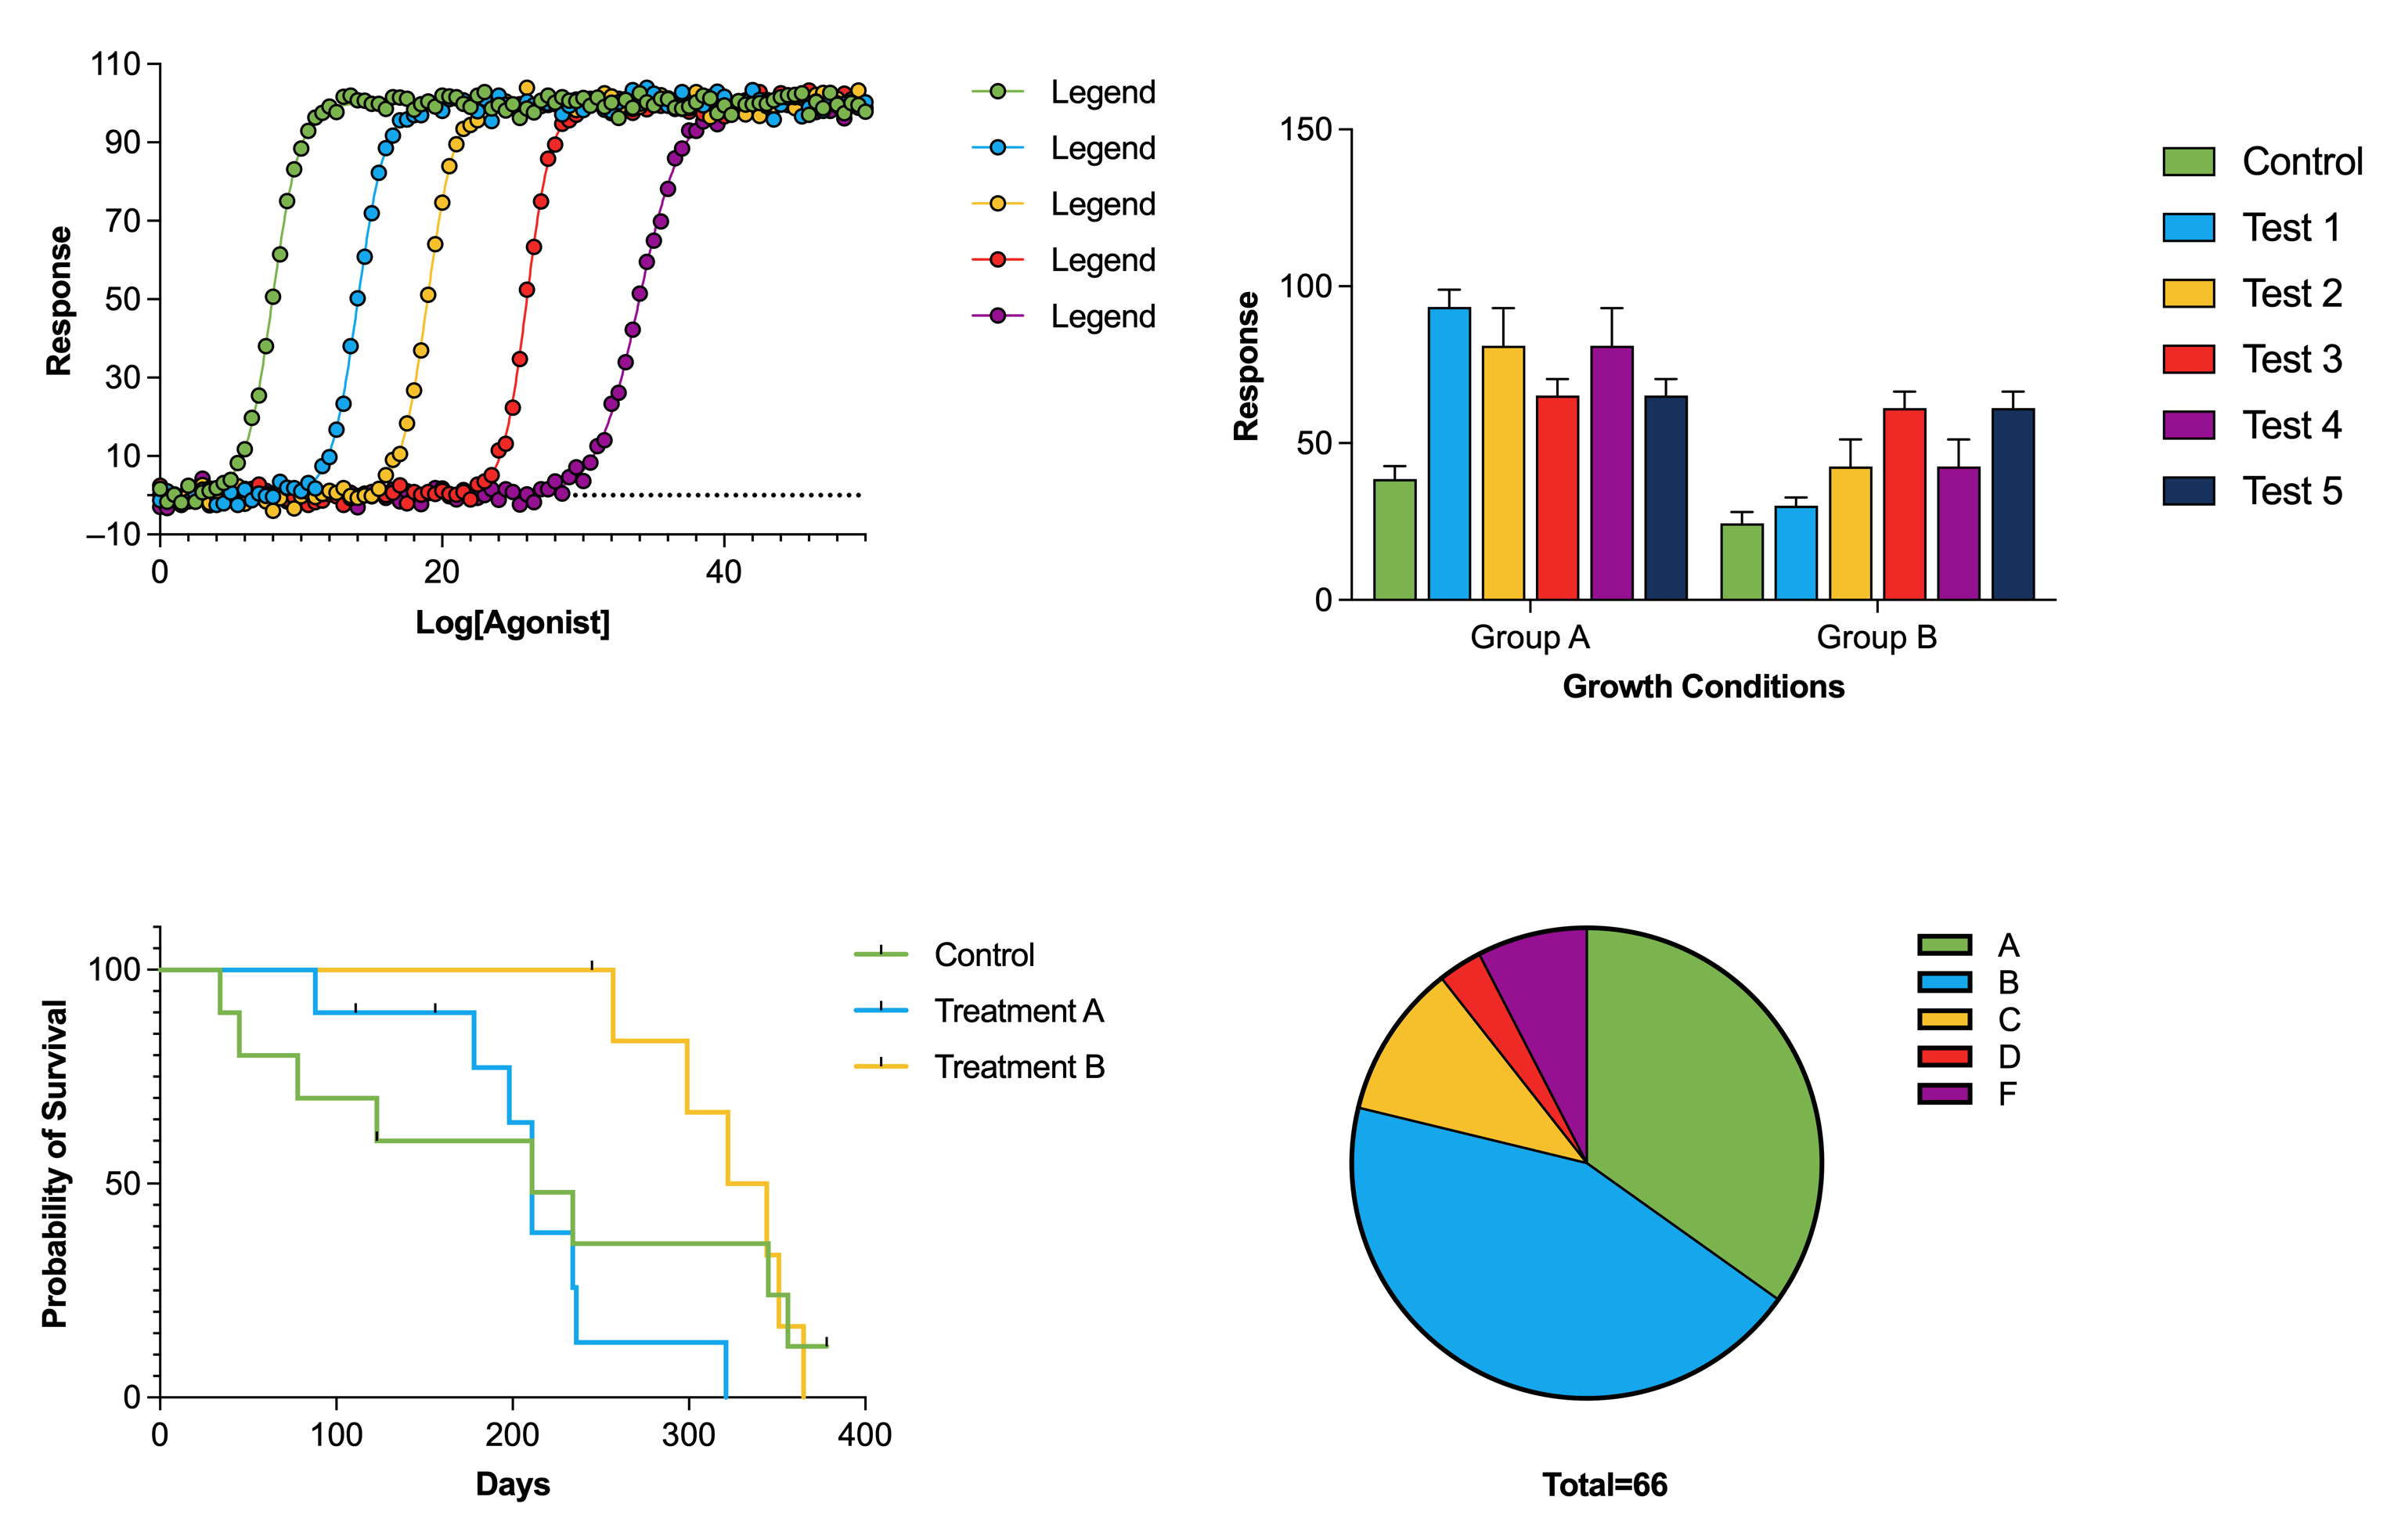
1970s: the first “Earth Day” and a lot of earth tones
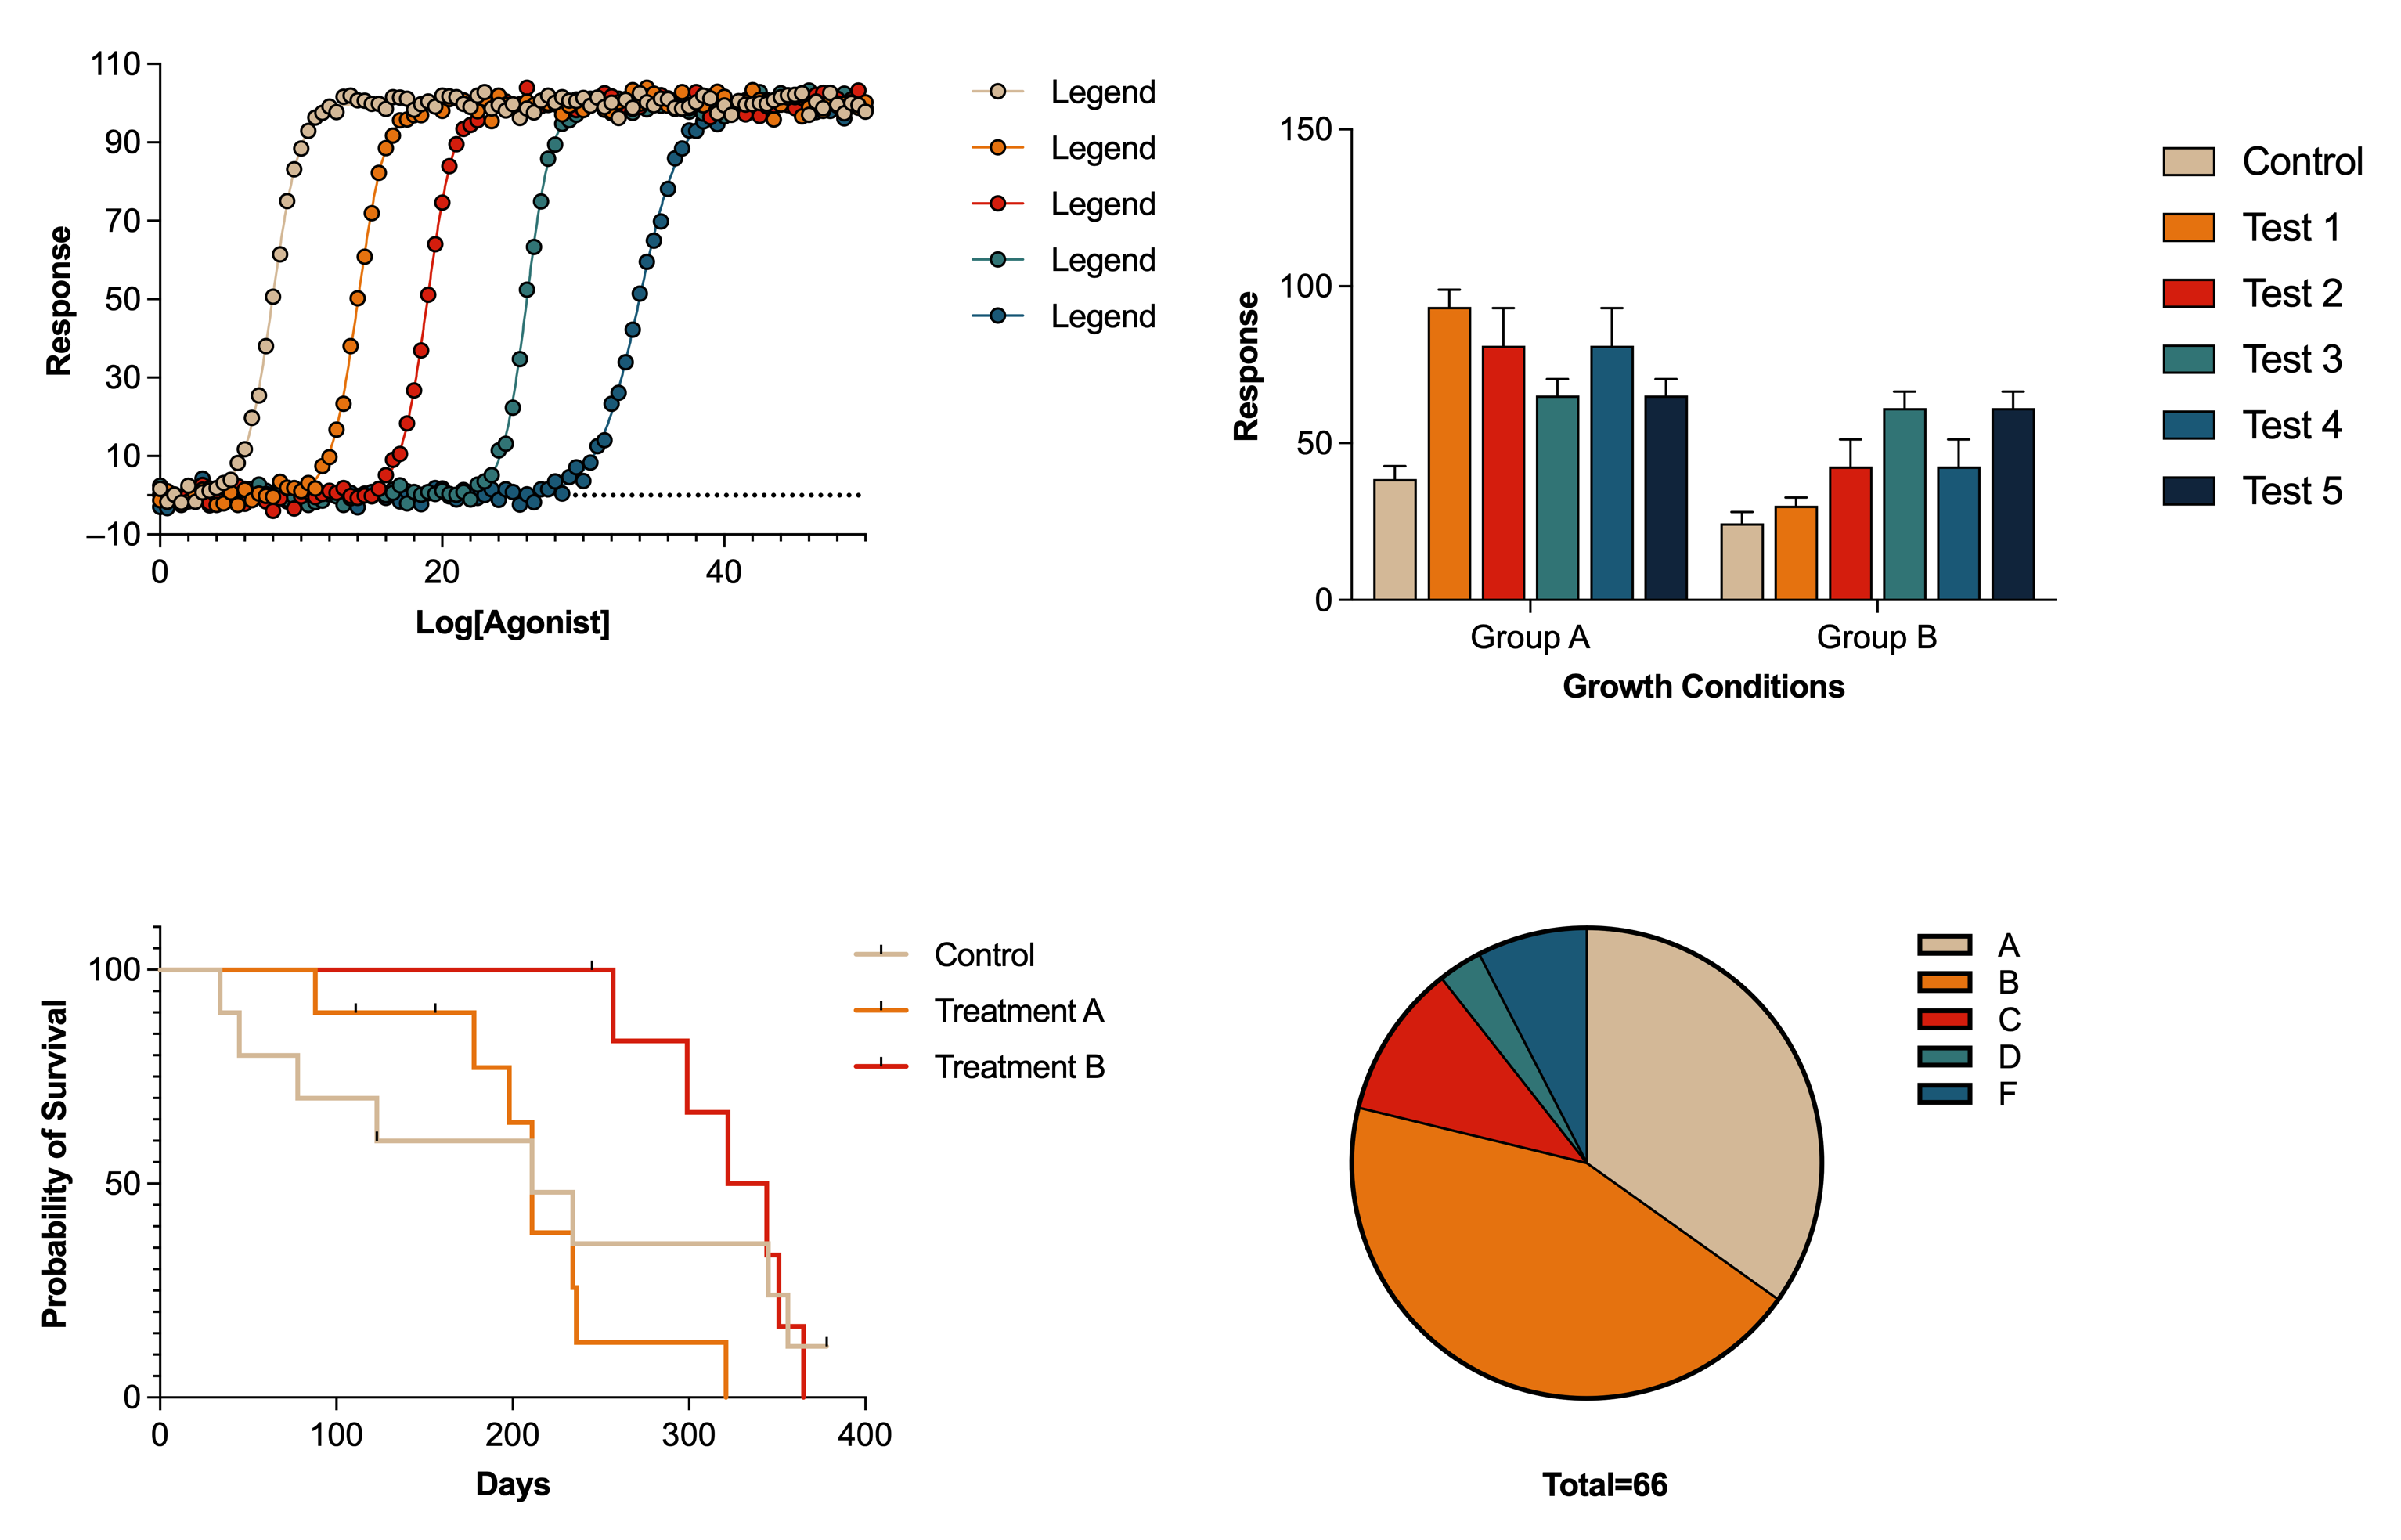
1980s: MTV, personal computers, and everything neon
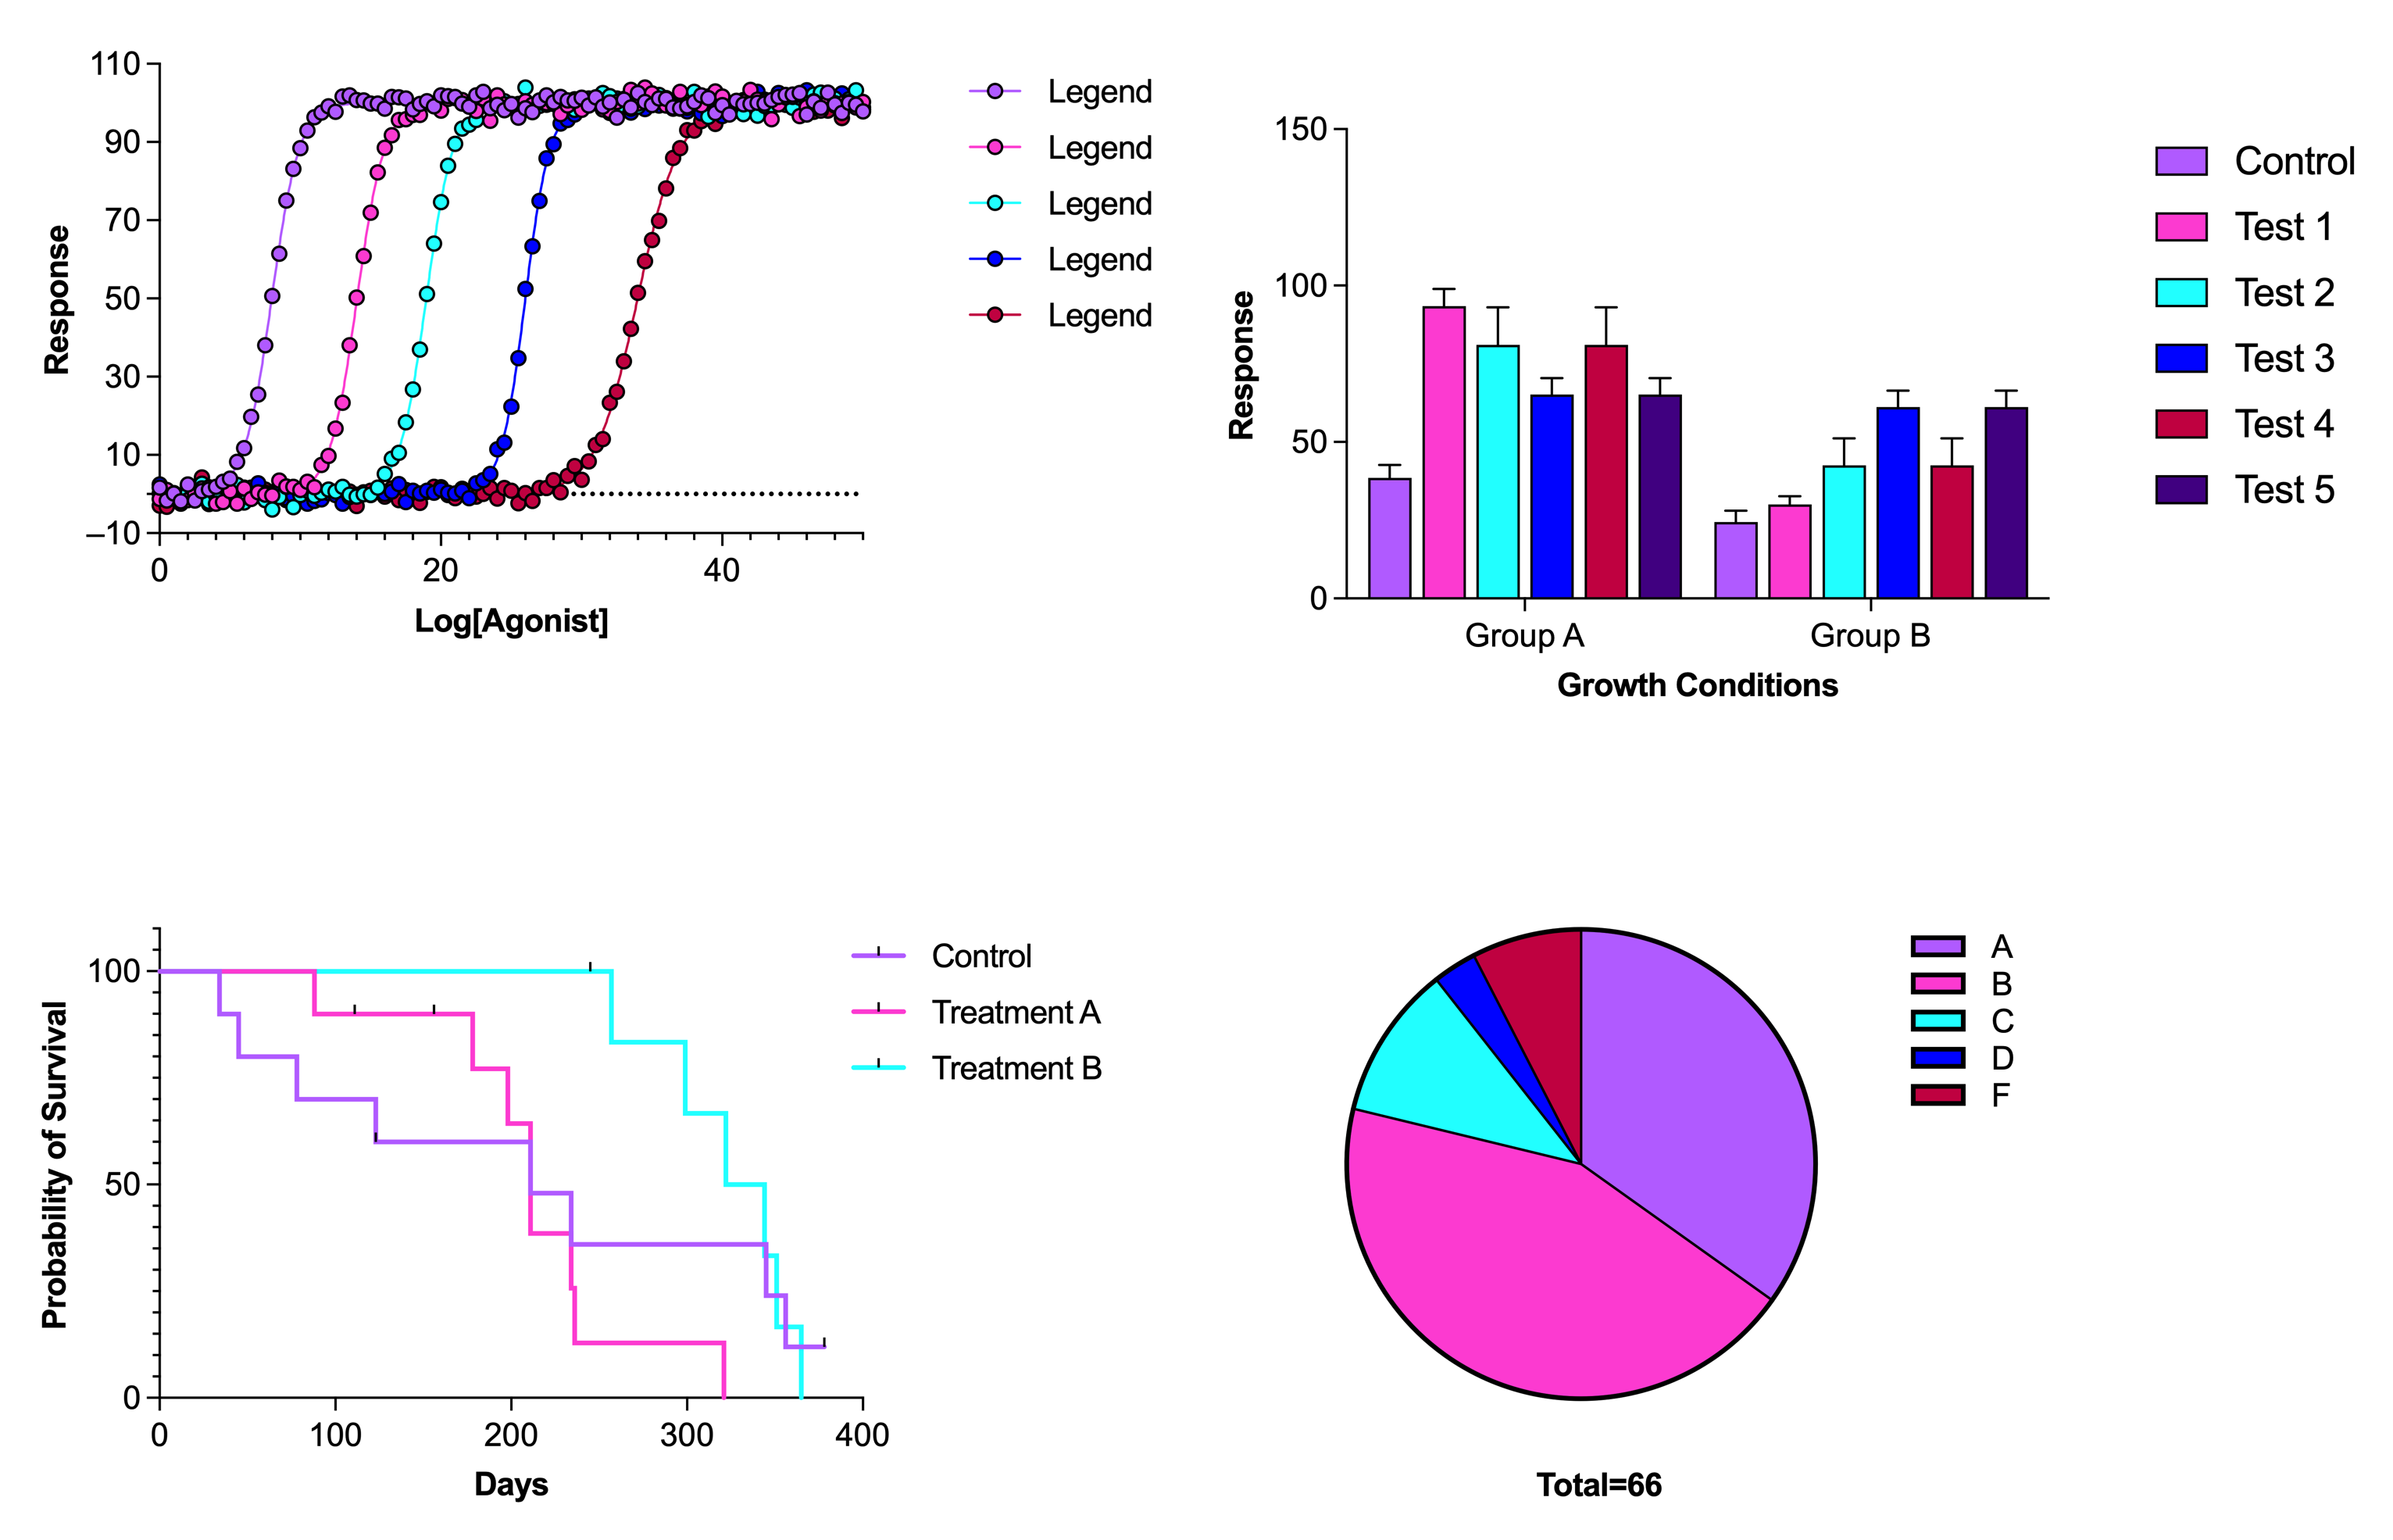
1990s: Grunge music, the Simpsons, and a lot of moodier colors
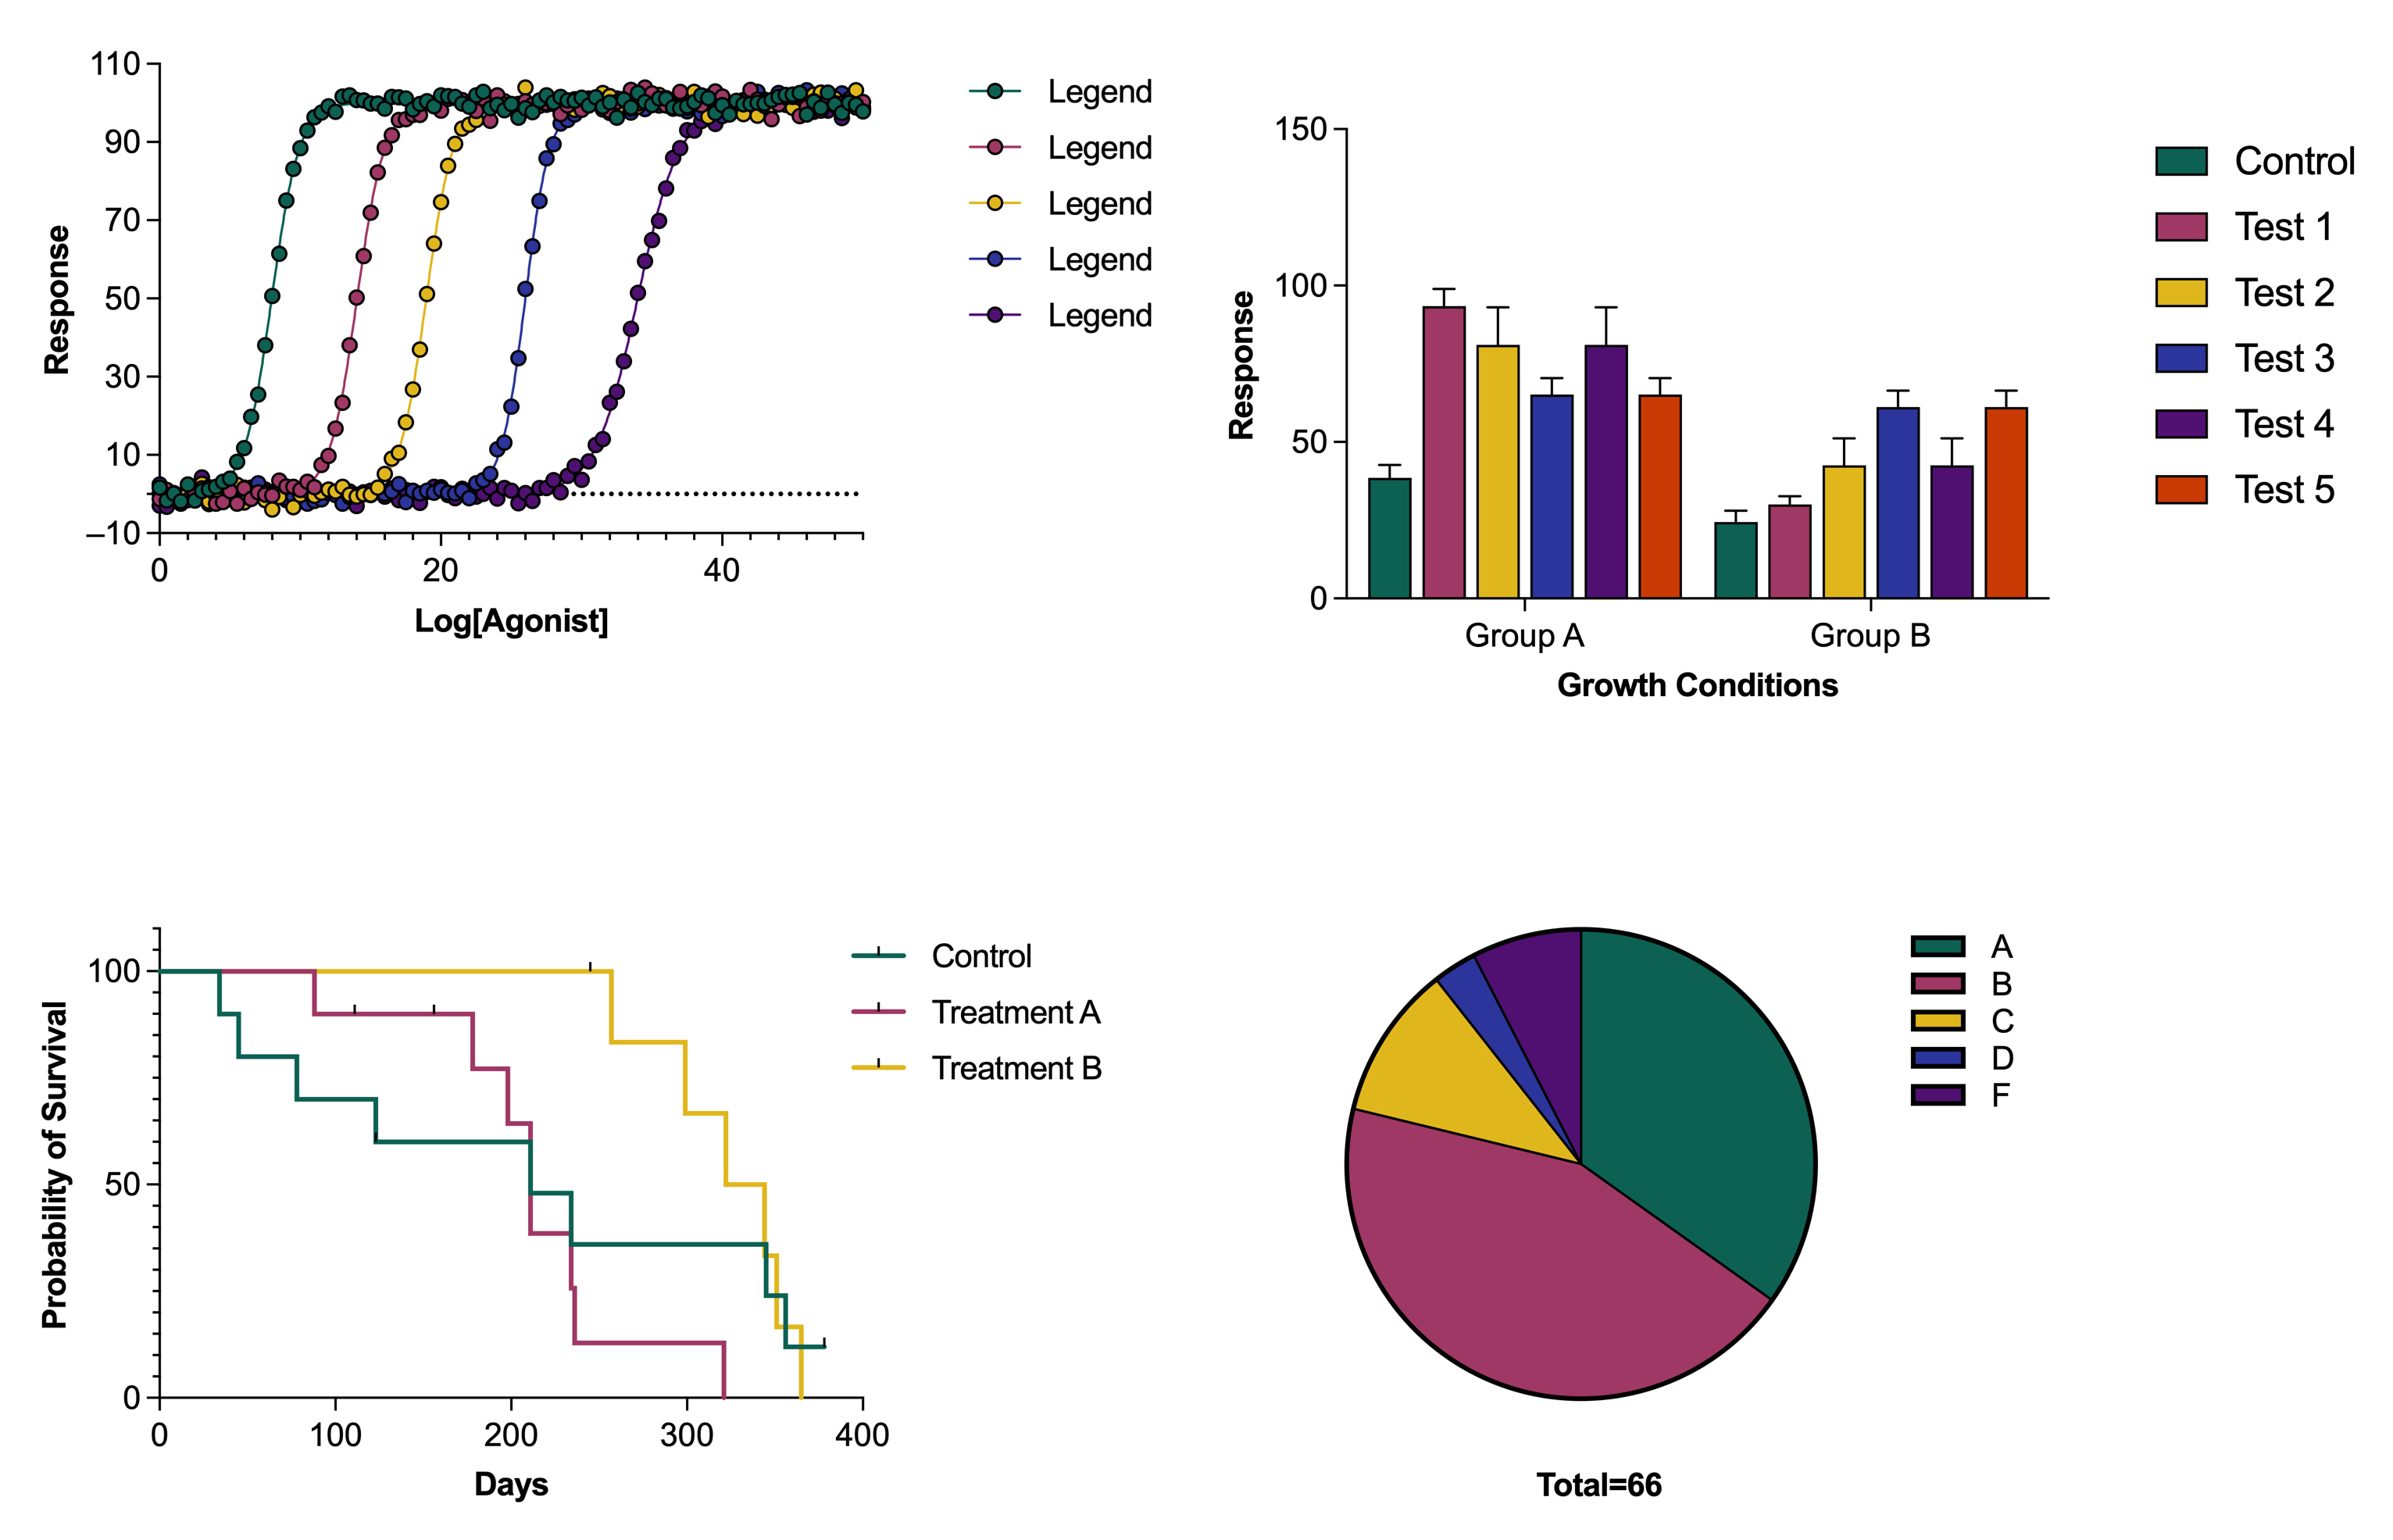
2000s: the rise of social media (and catchy app colors)
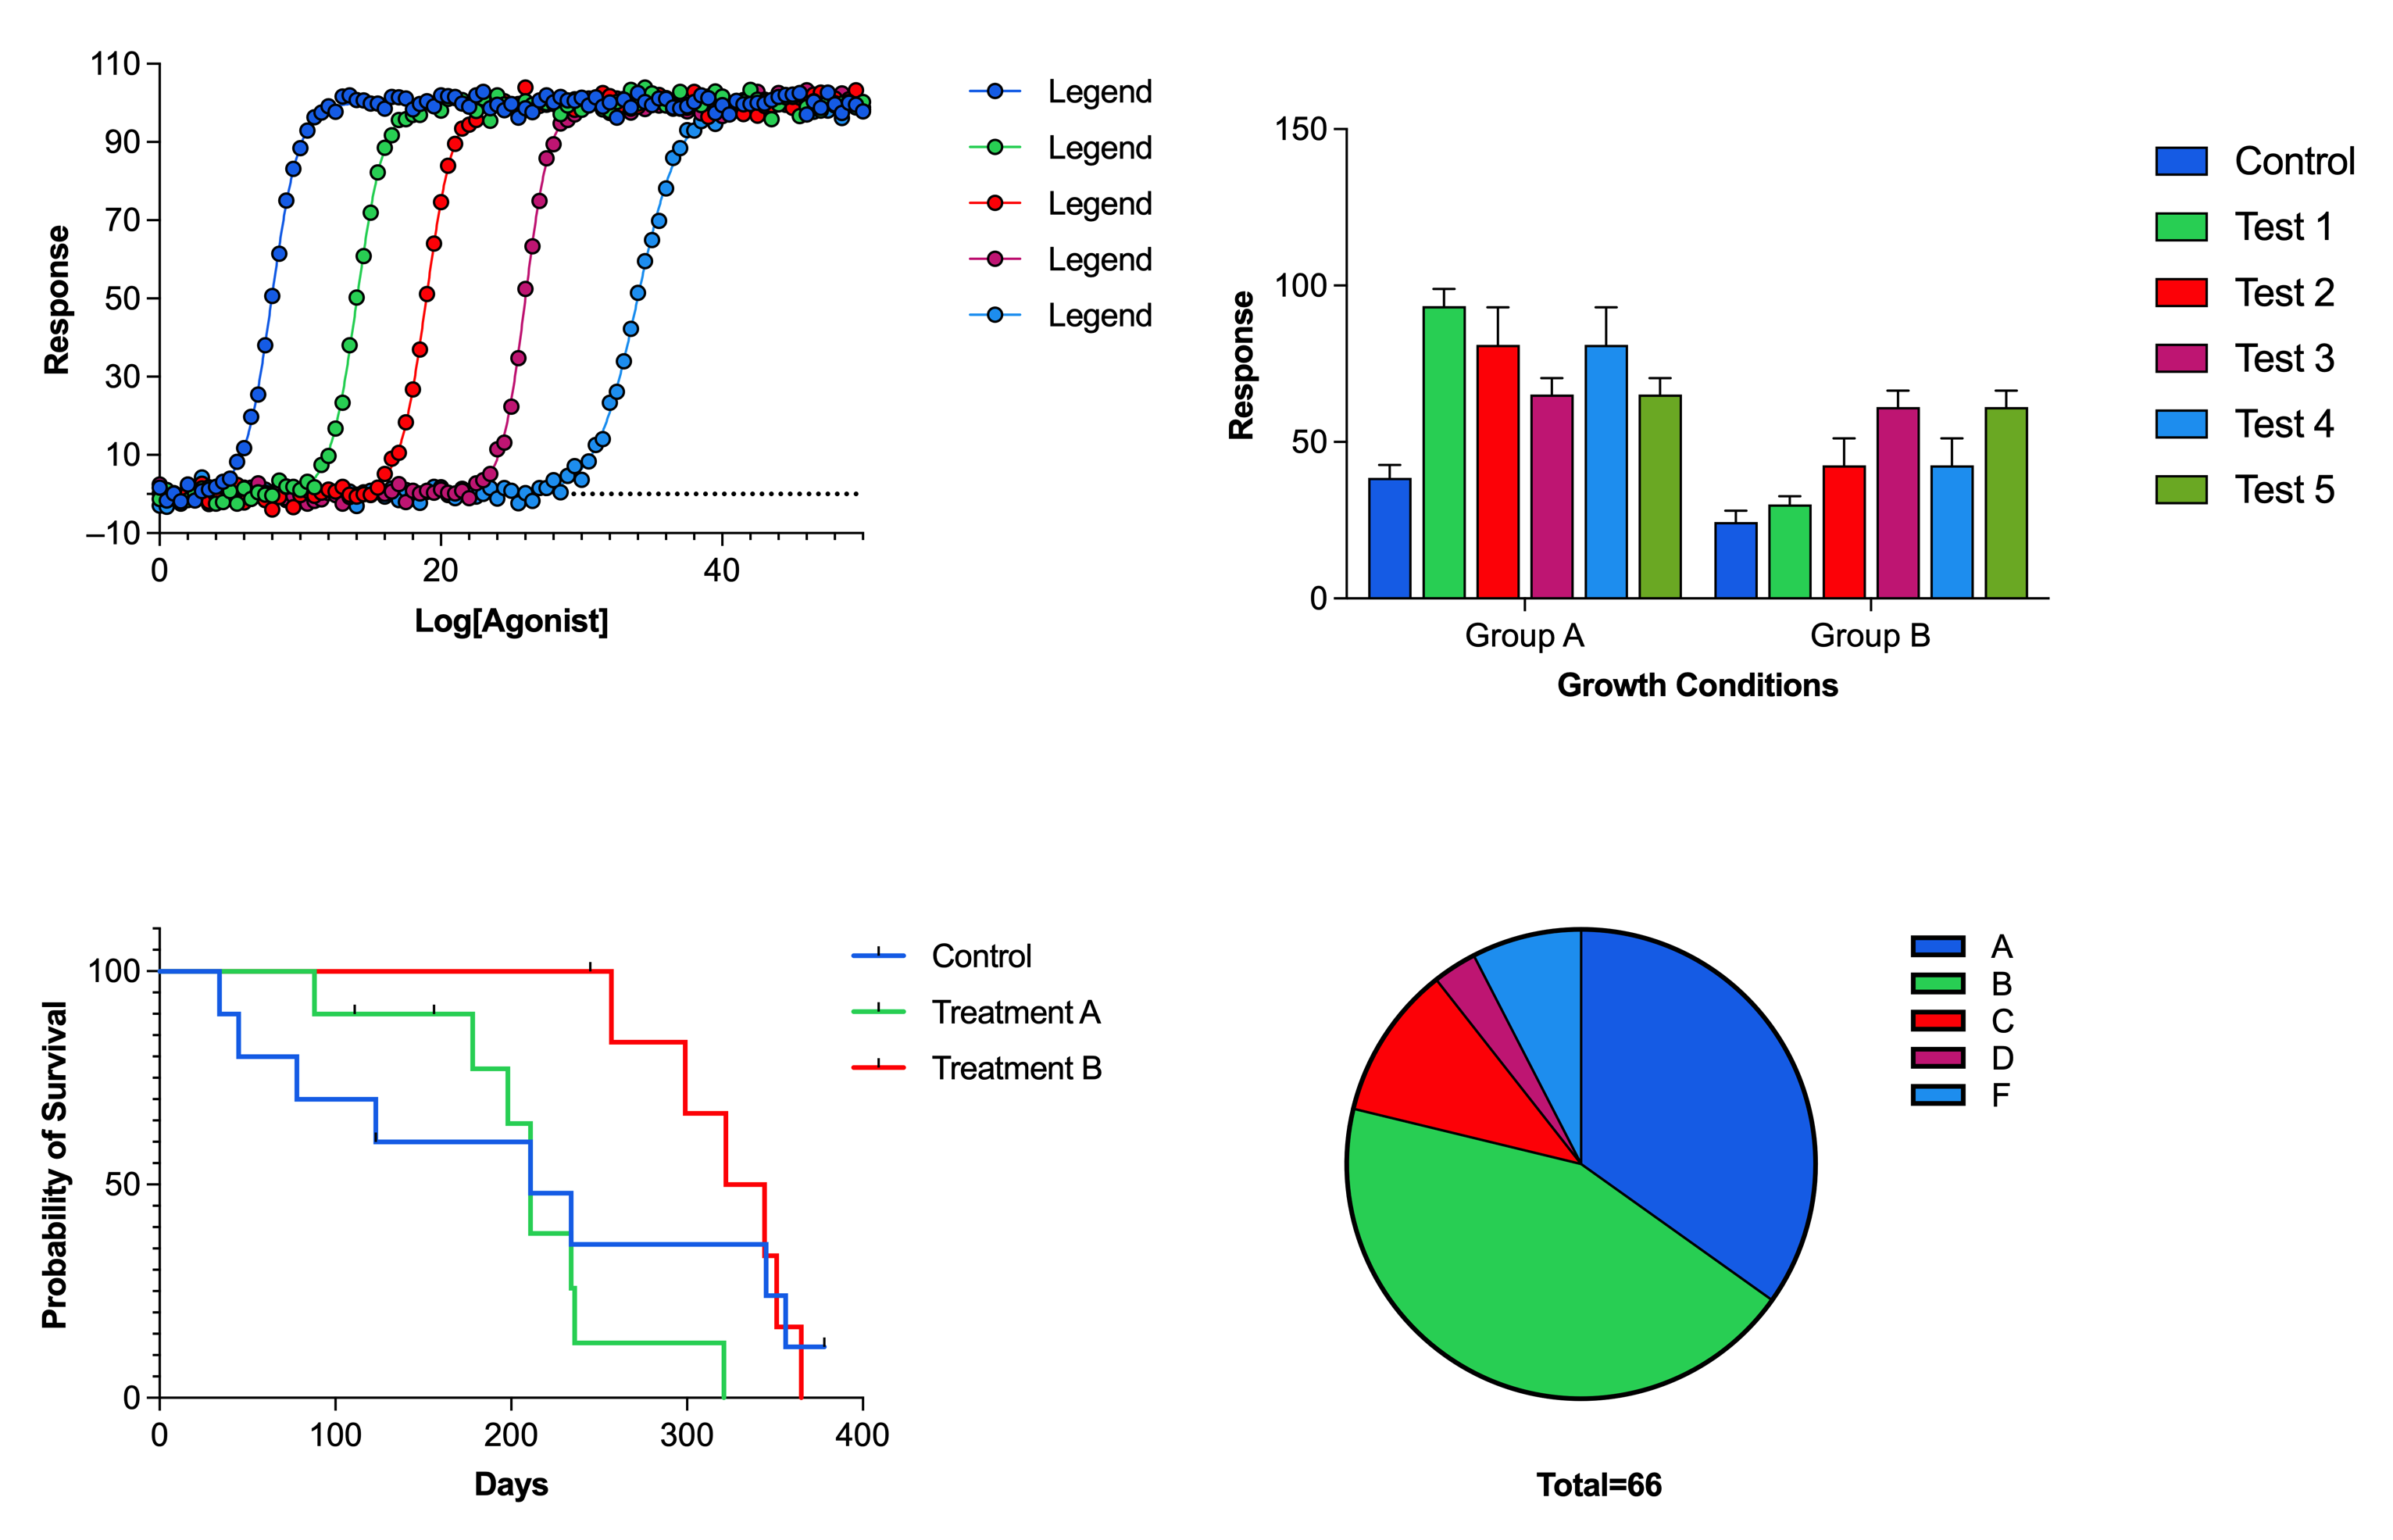
2010s: Pantone begins its "Color of the year" campaign
Fixing issues with creating your own color schemes
Prism 9.5 also fixes two separate issues (one on Mac and one on Windows) both related to saving your own color schemes. After creating a new color scheme using the “Define Color Scheme” dialog, you have the option to save the newly created color scheme for use in graphs that you make later. Prism will ask you to provide a name for the new color scheme. If you chose a name of a color scheme that already exists, Prism would do one of the following (depending on whether you were on Mac or Windows):
- Mac - if a color scheme with that name already existed, you’d have to choose a new name. You couldn’t overwrite an existing color scheme (even if it wasn’t a built-in color scheme and was one you defined yourself)
- Windows - if a color scheme with that name already existed, Prism would save over the old color scheme with the new one (unless the existing color scheme was a built-in color scheme: these can’t be replaced). This may have led to accidentally losing old color schemes
In Prism 9.5, we’ve improved and unified this behavior. Now, when trying to save a color scheme with a name that already exists, Prism will ask if you want to replace the existing color scheme or not. Note that built-in color schemes still cannot be replaced this way.
Prism Cloud Early Access

Prism Cloud is a brand new web-based application for sharing, viewing, and collaborating on your Prism projects with your peers. This new functionality is seamlessly integrated into the Prism desktop application, making it exceptionally simple to get started. With Prism Cloud, you no longer need to export your graphs and layouts or insert them into presentations or other files. You no longer need to send multiple emails back and forth with your collaborators. And you no longer have to repeat this entire process each time you receive feedback.
With Prism Cloud, you simply publish your work to your online workspace, share your published work with others (even if they don't have Prism!), and create and comment on discussions to get feedback in real time. Then, you can make changes to your Prism file and update the published work. Others that you've shared the work with in Prism Cloud will see your changes immediately with no need to send a new round of emails.
Currently, Prism Cloud is only available for individuals selected to participate in the Early Access program. You can sign up for the Early Access waitlist on this page. You can also get started by clicking the new Prism Cloud toolbar button in the Prism desktop application. If you're selected to participate in the Early Access program, we'll connect your Prism subscription to Prism Cloud, allowing you to start publishing your graphs and layouts.
Feature improvements
- Prism now generates the "Proportion of variance" graph by default when performing PCA (this graph is selected by default on the Graphs tab of the analysis parameters dialog when performing this analysis)
- Improved the wording for the alternative hypothesis when comparing parameters between model fits in nonlinear regression (the alternative hypothesis hasn't changed, only the wording has changed to be more clear about what is being tested). Depending on the number of parameters being compared, Prism uses the following wording:
- One parameter being compared: "[parameter name] different for at least one data set"
- Multiple (K) parameters being compared: "[K] parameters different for at least one data set"
- All parameters being compared: "Different curve for at least one data set"
- Moved the "Time" variable to the top of the list in the Predictions tab of the Cox Proportional Hazards Regression parameters dialog
- Improved the wordings in the "Interpolation" and "Predictions" tabs of the parameters dialogs for Multiple Linear Regression and Cox Proportional Hazards Regression analyses
- Simplified the wording of the summary on the Experimental Design tab of the Multiple t tests (and nonparametric tests) parameters dialog. Selected options should now be clearly summarized
- Changed the option "Geometric mean" to "Geometric mean and geometric SD factor" in the "Advanced" section of the Descriptive Statistics parameters dialog to indicate the results calculated when choosing this option
- Added an alert when a Nested one-way ANOVA or Nested t test is performed on data with no variation among replicates: "Prism cannot perform nested one-way ANOVA [Nested t test] because there is no variation among replicates in any of the subcolumns."
Analysis Bug Fixes
- (Windows) Fixed the unexpected limit of the "Definition" field in the "Transforms to Report" tab of the User-defined Equation dialog in nonlinear regression
Graphing Bug Fixes
- Fixed the issue in which the baseline unexpectedly appeared on a grouped graph with data shown as "Floating bars" and "Symbols"
- (Mac) [macOS 11 and 12] Fixed the issue in which lines and curves consisting of more than 256 connected segments appeared corrupted
Other Bug Fixes
- (Windows) Fixed the issue in which Prism could not launch MS PowerPoint or Word if corresponding registry entries were missing or corrupted
- (Windows) Prism now correctly opens the confirmation alert when attempting to overwrite a user-defined color scheme in the Define Color Scheme dialog
- (Windows) Fixed the issue related to Prism's digital certificate validation that occurred in Prism 9.4.1 on newly installed Windows devices. In these cases, an alert would incorrectly be shown, but should no longer be presented
- (Windows) Fixed the issue in which the labels in the Extract and Rearrange parameters dialog appeared cut on high DPI scalings
- (Windows) Fixed the issue in which the name of the info sheet was not updated after changing the parent data sheet's name
- (Windows) [Chinese] Fixed the location of the "Plot" label in the Format Pairwise Comparisons dialog
- (Mac) Prism now correctly allows overwriting user-defined color schemes by displaying an alert via the Define Color Scheme dialog
- (Mac) Fixed the rendering of the "Select all" link in the Parameters: Multiple Linear Regression dialog
- (Mac) Improved the UI of the Predictions tab of the Cox Proportional Hazards regression dialog by centering labels in the scenarios table
- (Mac) Renamed the "Graph Appearance..." item in the "Change" menu to the "Parts of Whole Appearance" for parts of whole graphs
- Fixed the typo ("Gaph" to "Graph") in the floating note of the "Donut Plot" portfolio file
Analyze, graph and present your scientific work easily with GraphPad Prism. No coding required.
