
50% of what? How exactly are IC50 and EC50 defined?
The concepts of IC50 and EC50 are fundamental to pharmacology. The EC50 is the concentration of a drug that gives half-maximal response. The IC50 is the concentration of an inhibitor where the response (or binding) is reduced by half.
Seems simple enough. But when you actually go to fit data to determine these values, there are several complexities and ambiguities.
The rest of this article is about IC50 (I for inhibition, for downward sloping dose-response curves). All the ideas can be applied to stimulatory curves and EC50 (E for effective) as well. Just stand on your head when you view the figures.
The ideal situation
This figure shows an ideal situation:
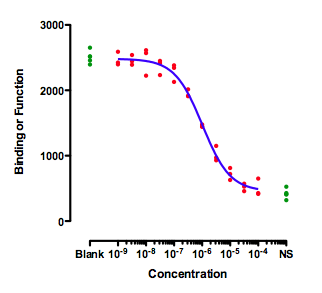
The green symbols show measurements made with controls. The ones on the left (Blank) have no inhibitor, so define "100%". The ones on the right are in the presence of a maximal concentration of a standard inhibitor, so define "0%". The data of the experimental dose-response curve (red dots) extend all the way between the two control values.
When fitting this curve, you need to decide how to fit the top plateau of the curve. You have three choices:
- Fit the data only, ignoring the Blank control values.
- Average the Blank control values, and set the parameter Top to be a constant value equal to the mean of the blanks.
- Enter the blank values as if they were part of the dose-response curve. Simply enter a low dose, perhaps 10-10 or 10-11. You can't enter zero, because zero is not defined on a log scale.
The results will be very similar with any of these methods, because the data form a complete dose-response curve with a clear top plateau that is indistinguishable from the blank. I prefer the third method, as it analyzes all the data, but that is not a strong preference.
Similarly, there are three ways to deal with the bottom plateau: Fit the data only, set Bottom to be a constant equal to the average of the NS controls, and put the NS controls into the fit as if they were a very high concentration of inhibitor.
That is the ideal situation. There is no ambiguity about what IC50 means.
A situation where IC50 can be defined in two ways
This figure shows an unusual situation where the inhibition curve plateaus well above the control values (NS) defined by a high concentration of a standard drug. This leads to alternative definitions of IC50.
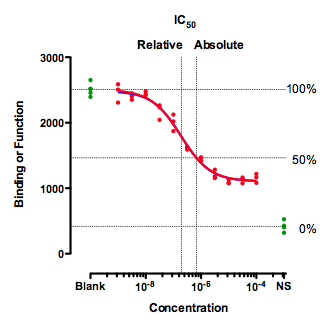
Clearly, a single value cannot summarize such a curve. You'd need at least two values, one to quantify the middle of the curve (the drug's potency) and one to quantify how low it gets (the drug's maximum effect).
The graph above shows two definitions of the IC50.
The relative IC50 is by far the most common definition, and the adjective relative is usually omitted. It is the concentration required to bring the curve down to point half way between the top and bottom plateaus of the curve. The NS values are totally ignored with this definition of IC50. This definition is the one upon which classical pharmacological analysis of agonist and antagonist interactions is based. With appropriate consideration of the biological system and concentrations of interacting ligands, estimated Kd values can often be derived from the IC50 value defined this way (not so for the "so-called absolute IC50" mentioned below).
The concentration that provokes a response halfway between the Blank and the NS value is sometimes called the absolute IC50, The horizontal dotted lines show how 100% and 0% are defined, which then defines 50%. This term is not entirely standard. Since this value does not quantify the potency of a drug, the authors of the International Union of Pharmacology Committee on Receptor Nomenclature (1) think that the concept of absolute IC50 (and that term) is not useful (R. Neubig, personal communication). I agree.
The concept (but not the term "absolute IC50") is used to quantify drugs that slow cell growth. The abbreviation GI50 is used for what we call here the absolute IC50. It is also used by the Environmental Protection Agency (EPA) in evaluating endocrine disrupters (Appendix A).They use the term IC50 to refer to the absolute IC50, and the term EC50 to refer to the relative IC50. They don't use the terms relative and absolute.
If you really want to use the absolute IC50, here are instructions for fitting a curve to find it.
Incomplete dose-response curves
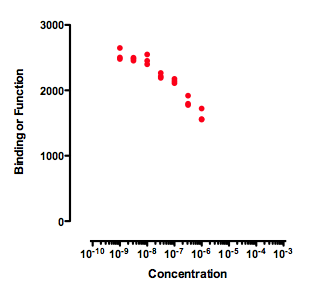
Any attempt to determine an IC50 by fitting a curve to the data in the graph above will be useless. A curve fitting program might, or might not, be able to fit a dose-response curve to the data. But if the curve fits, the value of the IC50 is likely to be meaningless and have a very wide confidence interval. The data simply don't form a top plateau (which would define 100) or a bottom plateau (which would define 0). If data haven't defined 100 or 0, then 50 is undefined too, as is the IC50.
If you also have control values that define 100 and 0, then the curve can be easily fit. The curve below was created by fitting a dose response curve, but constraining the Top plateau to be a constant value equal to the mean of the Blanks values, and the Bottom plateau equal to the mean of the NS values.
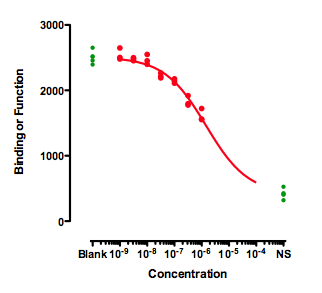
The value of the IC50 fit this way only makes sense if you assume that higher concentrations of the inhibitor would eventually inhibit down to the NS values. That is an assumption that can't be tested with the data at hand.
The distinction between relative and absolute IC50 doesn't really apply to these data. Because the data don't define a bottom plateau, the IC50 must be defined relative to the NS control values.
Fitting normalized data
As you can see from all the examples above, it is not necessary to normalize the data to run from100% down to 0%. You can fit curves using data in their natural units. A common mistake is to assume that fitting dose-response curves requires that data first be normalized.
If you choose to normalize your data, it is essential that you think through carefully (and document in methods sections of papers) how 100% and 0% are defined. There are three strategies you can use:
- From external controls (Blank and NS in the figures above). Since these values are so important, consider measuring these controls with more replicates than used for the rest of the experiment.
- From very low and very high concentrations of the test substance.
- From the plateaus of nonlinear regression. Fit the curve first, and then use the best-fit values of the Top and Bottom plateau to normalize the data.
If you fit normalized data, you probably want Prism to force the curve to go from 100 down to 0. It won't know to do this, unless you tell it. Don't make the common mistake of normalizing your data, but not constraining the curve to go from 100 down to 0. You can constrain the curve in two ways:
- Choose to fit to a normalized model. The normalized models built in to Prism always go between 0 and 100.
- Use a more general model, go to the Constrain tab, and set Bottom to a constant value of 0.0 and Top to a constant value of 100.0.
Summary
The concept of IC50 (or EC50) is a bit ambiguous unless you clearly specify which values define 100% and 0%.
Reference
1. R. R. Neubig et al. International Union of Pharmacology Committee on Receptor Nomenclature and Drug Classification. XXXVIII. Update on terms and symbols in quantitative pharmacology. Pharmacol Rev (2003) vol. 55 (4) pp. 597-606
Download
Download the Prism file used to create all the graphs in this article.