- Prism
FEATURES
Analyze, graph and present your workComprehensive analysis and statisticsElegant graphing and visualizationsShare, view and discuss your projectsLatest product features and releasesPOPULAR USE CASES
- Enterprise
- Resources
- Support
- Pricing
Survival Analysis
Survival analysis reveals insights into time-to-event data, enhancing prediction and understanding of outcomes

Survival Analyses Supported by Prism
Prism is already formatted for the survival analysis test you want to run:
Kaplan-Meier Survival Analysis
A simple and common method to estimate the survival curve.
Cox Proportional Hazards Regression
A model which allows additional variables to be included, assuming that the hazard ratio when comparing two groups is consistent over time.
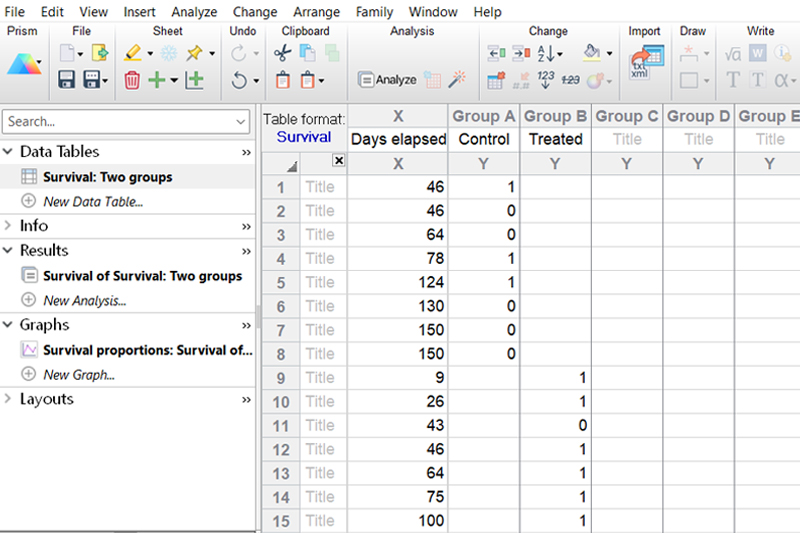
Performing Simple Survival Analysis in Prism
See how to execute Kaplan-Meier 3 simple steps:

Involve your team at any step in the process.
Share your data, analyses, and graphs in one click.
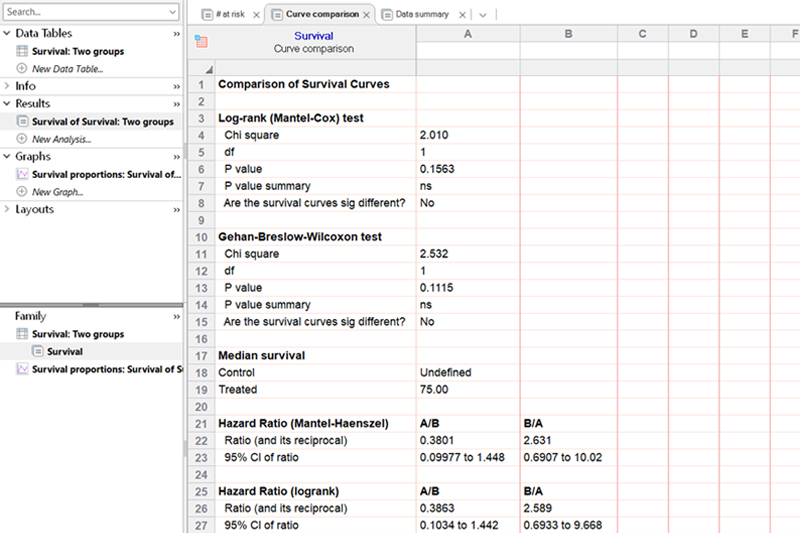
Survival Analysis Highlights
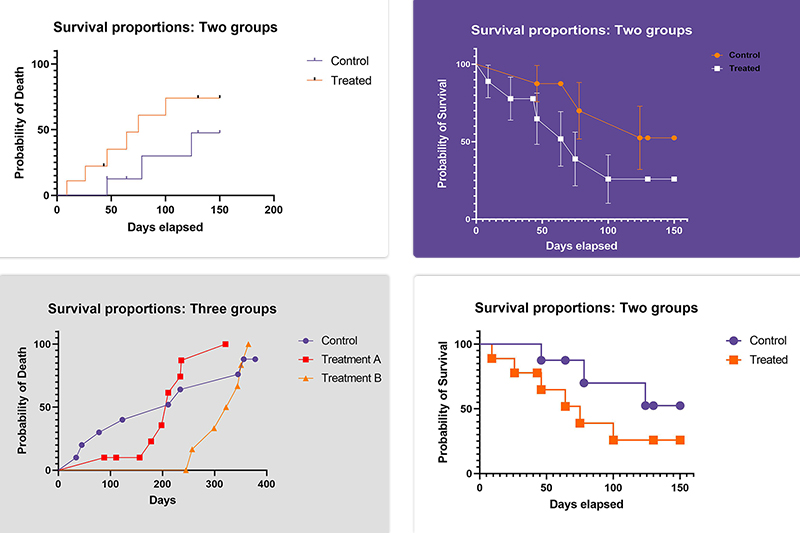
Prism is purpose-built for scientists to easily perform Survival Analysis, which estimates the lifespan of a population over the timespan of an experiment. More specifically, Survival curves graphically represent the data collected in these experiments, showing the relationship between elapsed time and survival probability. If survival curves for different groups or populations have been generated (using the Kaplan-Meier estimation method), these can be compared using the log rank test.
Survival Analysis can be used to answer many questions :
- How much of a population will survive past a certain time?
- At what rate will the event occur?
- Should multiple variables be considered a cause?
Access Other Survival Analysis Resources


Start Free 30 Day Trial
No credit card required.