
How do I know if my data have a normal distribution?
You can test the hypothesis that your data were sampled from a Normal (Gaussian) distribution visually (with QQ-plots and histograms) or statistically (with tests such as D'Agostino-Pearson and Kolmogorov-Smirnov). However, it’s rare to need to test if your data are normal. Most likely you’re fitting some type of statistical model to your data such as ANOVA, linear regression, and nonlinear regression. In these cases, the assumption is that the residuals, the deviations between the model predictions and the observed data, are sampled from a normally distribution. The residuals need to be approximately normally distributed to get valid statistical inference such as confidence intervals, coefficient estimates, and p values.
This means that the data don’t necessarily need to be normally distributed, but the residuals do.
In this article, we will take a deeper dive into the subject of normality testing, including:
-
Statistical test for normality with common statistical models
-
How to determine if data is normally distributed using visual and statistical tests
-
Normally distributed data examples
-
What to do if the residuals are not normal
How to test for normality with common statistical models
Linear and nonlinear regression
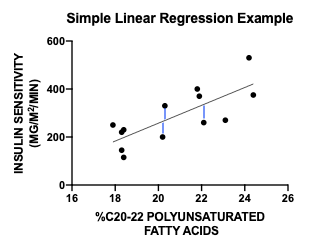
With simple linear regression, the residuals are the vertical distance from the observed data to the line. In this case, the tests for normality should be performed on the residuals, not the raw data.
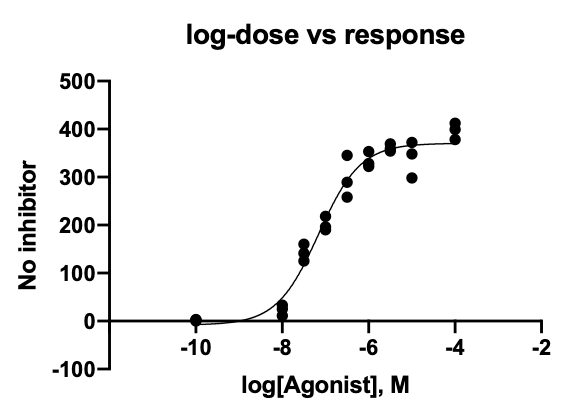
The same idea applies to nonlinear regression, where the model fits a curve instead of a straight line. The p-values and confidence intervals are based on the assumption that the residuals are normally distributed.
Note the language. The shorthand (used above) is to test the assumption that the residuals are normally distributed. What this really means is testing the assumption that the residuals are sampled from a normal distribution, or are sampled from a population that follows a normal distribution.
T tests (paired and unpaired)
With t tests and ANOVA models, it appears a little different, but it’s actually the same process of testing the model residuals.
With paired t tests, which are used when two measurements are taken on the same data point (for example, before and after measurements for each test subject), the model assumption is that the differences between the two measurements are normally distributed. So in that case, simply test the difference for normality. A common mistake is to test each group as being normally distributed.
With unpaired t tests, when comparing if the means between two different independent groups (such as male vs female heights), both columns of data are assumed to be normal, and both should be tested either individually or jointly if you assume equal variance and test the residuals, the difference of each column value minus its respective estimated mean, not the raw data.
Are your residuals for t tests clearly deviating a little from normality? Note that t tests are robust to non-normal data with large sample sizes, meaning that as long as you have enough data, only substantial violations of normality need to be addressed.
Perform a t test in Prism today.
ANOVA with fixed effects
In two-way ANOVA with fixed effects, where there are two experimental factors such as fertilizer type and soil type, the assumption is that data within each factor combination are normally distributed. It’s easiest to test this by looking at all of the residuals at once. In this case, the residuals are the difference of each observation from the group mean of its respective factor combination.
A common mistake is to test for normality across only one factor. Using the fertilizer and soil type example, the assumption is that each group (fertilizer A with soil type 1, fertilizer A with soil type 2, …) is normally distributed. It’s not the same thing to test if fertilizer A data are normally distributed, and in fact, if the soil type is a significant factor, then they wouldn’t be.
As long as you’re assuming equal variance among the different treatment groups, then you can test for normality across all residuals at once. This is useful in cases when you have only a few observations in any given factorial combination.
Test the normality of your data before conducting an ANOVA in Prism.
How to test for normality
There are both visual and formal statistical tests that can help you check if your model residuals meet the assumption of normality. In Prism, most models (ANOVA, Linear Regression, etc.) include tests and plots for evaluating normality, and you can also test a column of data directly.
Visually
Q-Q Plot
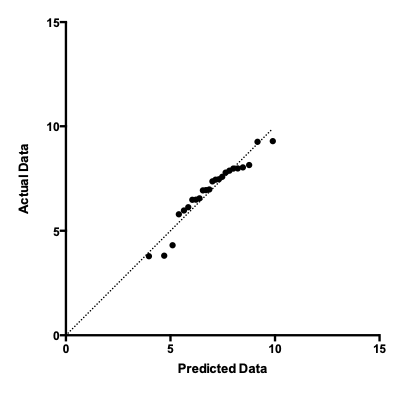
The most common graphical tool for assessing normality is the Q-Q plot. In these plots, the observed data is plotted against the expected quantiles of a normal distribution. It takes practice to read these plots. In theory, sampled data from a normal distribution would fall along the dotted line. In reality, even data sampled from a normal distribution, such as the example QQ plot below, can exhibit some deviation from the line.
Frequency distribution
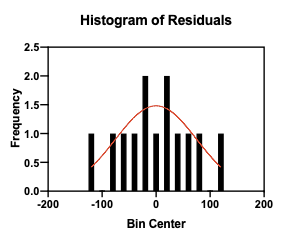
You may also visually check normality by plotting a frequency distribution, also called a histogram, of the data and visually comparing it to a normal distribution (overlaid in red). In a frequency distribution, each data point is put into a discrete bin, for example (-10,-5], (-5, 0], (0, 5], etc. The plot shows the proportion of data points in each bin.
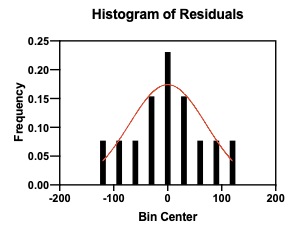
While this is a useful tool to visually summarize your data, a major drawback is that the bin size can greatly affect how the data look. The following histogram is the same data as above but using smaller bin sizes.
With statistical tests
There are many statistical tests to evaluate normality, although we don’t recommend relying on them blindly. Prism offers four normality test options: D'Agostino-Pearson, Anderson-Darling, Shapiro-Wilk and Kolmogorov-Smirnov. Each of the tests produces a p-value that tests the null hypothesis that the values (the sample) were sampled from a Normal (Gaussian) distribution (or population). :
-
If the p-value is not significant, the normality test was “passed”. While it’s true we can never say for certain that the data came from a normal distribution, there is not evidence to suggest otherwise.
-
If the p-value is significant, the normality test was “failed”. There is evidence that the data may not be normally distributed after all.
If that does not fit with your intuition, remember that the null hypothesis for these tests is that your sample came from a normally distributed population of data. So as with any significant test result, you are rejecting the idea that the data was normally distributed. See our guide for more specific information and background on interpreting normality test p-values.
Which is better: visual or statistical tests?
We recommend both. It’s always a good idea to plot your data, because, while helpful, statistical tests have limitations. This is especially true with medium to large sample sizes (over 70 observations), because in these cases, the normality tests can detect very slight deviations from normality. Therefore, if your data “fail” a normality test, a visual check might tell you that even if the data are statistically not normal, they are practically normal.
Get started in Prism with your free 30 day trial today.
What if my residuals aren’t normally distributed?
If there is evidence your data are significantly different from the expected normal distribution, what can you do?
Some models are robust to deviations from normality
Depending on the model you are using, it may still provide accurate results despite some degree of non-normality. 1-Way ANOVA, for example, is often robust even if the data are not very close to normal.
Transformations
In some situations, you can transform your data and re-test for normality. For example, log transformations are common, because lognormal distributions are common (especially in biology)
Non-Parametric Tests
If your data truly are not normal, many analyses have non-parametric alternatives, such as the one-way ANOVA analog, Kruskal-Wallis, and the two-sample t test analog, Mann-Whitney. These methods don’t rely on an assumption of normality. The downside is that they generally also have less power, so it’s harder to detect statistical differences. Here are some recommendations to determine when to use nonparametric tests.
Keywords: normal distribution