- Prism
FEATURES
Analyze, graph and present your workComprehensive analysis and statisticsElegant graphing and visualizationsShare, view and discuss your projectsLatest product features and releasesPOPULAR USE CASES
- Enterprise
- Resources
- Support
- Pricing
Prism 10.2.0
Prism 10.2.0 was released on February 08, 2024.
Welcome to Prism 10.2.0!
This version of Prism introduces multiple highly requested features, including:
- Dark mode for macOS: Prism will now adopt your system settings for Dark Mode with re-designed dialogs, toolbars, and table elements in a stylish dark theme
- Compact Letter Display: reduce the clutter on your graphs while presenting your pairwise comparisons from one-way and two-way ANOVA by using letters instead of asterisks to indicate groups with statistically significant differences
- Re-designed Color Scheme menu: view the colors for each color scheme directly in the menu, quickly access recently used color schemes, and browse your own user-defined color schemes
- New Prism Cloud controls: quickly get signed in to your Prism Cloud account and start publishing your work with simplified and more intuitive controls
- And much more!!
Dark Mode for macOS
If only you knew the power of the Dark Side...
-Darth Vader


Introducing Dark Mode for Prism! Enjoy a completely refreshed visual experience with a sleek dark design to reduce eye strain and improve general interaction. This stylish new design is automatically enabled when Dark Mode is enabled on your device to match your working environment.
Compact Letter Display

Many One-way and Two-way ANOVA analyses involve performing multiple comparisons in which each group mean is compared to every other group mean. Depending on the number of groups involved, this can result in many individual comparisons. Summarizing all of these comparisons with brackets and asterisks on your graph can end up taking up a lot of space and making it difficult to interpret the results.
The Compact Letter Display (or CLD) addresses this issue by replacing all of these asterisks and brackets with a set of letters assigned to each group that can be used to assess all comparisons involving that group. Essentially, if any two groups share a letter, the comparison between these two groups was found to not be statistically significant. If any two groups don't share a letter, the comparison between these two groups was found to be statistically significant.
Adding a CLD to a graph is available for data that have been analyzed in one of the two following ways:
- One-way ANOVA with the multiple comparisons method "Compare the mean of each column with the mean of every other column"
- Two-way ANOVA with the multiple comparisons method "Compare cell means regardless of rows and columns"
Re-designed Color Scheme Menus
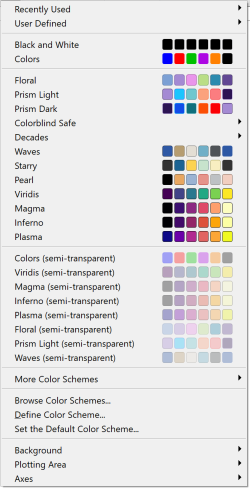
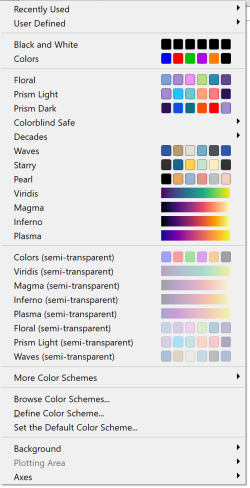
Applying colors to your graph is one of the best ways to emphasize your results, and make sure your visualization looks just the way you want it. So choosing colors shouldn't involve any guesswork. In Prism 10.2.0, we've updated the design of the Color Scheme menus to include previews of the fill and border colors that will be applied to the graph. For graphs with continuous color maps, available color schemes will also show the gradient map that will be used.
Additionally, we've added sections for "Recently Used" and "User Defined" color schemes as well so that you can quickly access your favorite color options. Now you can choose your colors with more confidence and get the exact look you want for your graphs.
Updated Prism Cloud Controls

We've made it easier to get signed in and get started with Prism Cloud. With these improved controls, we've made it simpler to publish your projects, share your published work, explore your Prism Cloud workspace, or just learn more about what Prism Cloud has to offer.
Start exploring today and keep an eye out for more exciting improvements coming soon!
Complete Release Notes
New Features
- Implemented support for Dark Mode (macOS only)
- Introduced the "Compact Letter Display" visualization method for summarizing the results of a set of multiple comparisons
- Implemented support of SSO methods for signing into LabArchives
Feature Improvements
- Update the UI/UX of the Prism Cloud commands in the toolbar
- Implemented multiple changes to the Color Scheme menu:
- Added preview color palettes to each color scheme
- Added gradient color maps for Viridis, Magma, Plasma, and Inferno for heat maps
- Added the "Recently Used" and "User Defined" options to the Color Scheme menu
- Added the SUM and COUNT transforms to the set of available functions in the Select and Transform analysis
- Improved the design of the Compare sub dialog for multiple comparisons of preselected pairs of columns int he One-way and Nested ANOVA analyses by adding a tree view and selected comparisons counter
- Added horizontal scroll bars to the "Comparisons on Graph" tab of the "Format Comparisons" dialog
- Enabled the "Decimals" option in the "Format Axes" dialog for the scale options "log 10", "log 2", the "Antilog" format, and minimum range > 1
- Added "Left panel" to the Navigator command, and "Right panel" to the Inspector command in the View menu
- Updated the link for customer support in the Services tab of the Preferences dialog
- Updated the multiple variables data preview in the Welcome Dialog to include a graph example
- Improved the auto-recovery functionality to restore lost data in data tables due to unexpected run-time structures stored within the file
- Updated the data table previews to correspond to the graph preview in the Survival section of the Welcome/New Data Table and Graph dialog
- (Mac) Enabled the "Center everything on the page" command on Layout sheets
Performance
- Improved the performance of importing large data ranges (grouped data 104x52x1800) in TXT, CSV, and XML formats to Prism's data tables so that Prism 10.2 is now faster than previous versions of Prism 10
- Improved the performance of calculating the Correlation analysis with huge amounts of data so that Prism 10 is noticeably faster than Prism 9
- Improved the performance of switching from modified data tables to linked graphs and results (linear regression, correlation, outlier detection, descriptive statistics)
- Improved the performance of saving projects in the PRISM format with large amounts of data (~200000x10x5) compared to previous versions using the PZFX format
- (Windows)Improved the performance of calculating the Linear Regression analysis with large amounts of data so that Prism 10 is now slightly faster than Prism 9
- (Windows) Improved the performance of copying layouts with many graphs to the Clipboard so that Prism 10 is now noticeably faster than Prism 9
- (Windows) Fixed the issue in which a long delay occurred when moving text or drawing objects on a multiple variables graph
- (Windows) Improved the performance of switching to a grouped graph that renders a large amount of data (15x1600) so that Prism 10 is several times faster than Prism 9
- (Windows) Improved the performance of copying large ranges of data (1024x16x500) from Microsoft Excel documents and pasting it with a link to Prism's data table so that Prism 10 is now twice as fast as Prism 9
- (Mac) Improved the performance of the "Duplicate Family" operations in projects with a large number of sheets
Analysis-related Bug Fixes
- Fixed the issue in which "Deviance vs HR" and "Martingale vs HR" graphs generated by the Cox proportional hazards regression analysis appeared empty in projects re-saved i the .prism file format from the .pzfx format
- Fixed the rare issue in which it was impossible to open a Prism file due to corrupted links between results sheets
- Fixed the issue in which Prism sometimes crashed while opening pzfx files with corrupted analysis parameters
- Fixed the issue in which pairwise comparisons were not generated from Two-way ANOVA results with the option "Within each column/row, compare rows/columns" while "One family for all comparisons" was selected
- Fixed the issue in which Prism did not report transform results for the cube root of negative values
- Fixed the issue in which the column mean appeared unexpectedly unhooked in the "Simulate Column Data" parameters dialog after saving the project in the .prism file format and re-opening the file
- Fixed the issue in which Prism would crash while performing Principal Component Analysis while using a continuous variable for symbol sizes of the PC Scores graph and the Center method for data
- Fixed the issue in which names of the Multiple Comparisons CI graph for Three-way ANOVA
- Fixed the issue in which P values were reported incorrectly for multiple comparisons using Dunnett's test with extremely large degrees of freedom
- (Win) Fixed the issue in which the frequency of the response variable was incorrect for multiple logistic regression
- (Win) Fixed the issue in which the "Change the concentration to" and "Constant" values in the results of the "Transform concentrations (X)" analysis were not saved in the .prism file format after opening the project in the .pzf/pzfx file format
- (Win) Fixed the issue in which the "Nothing to hook" alert was displayed after adding a hooked constant for the Fit Spline/LOWESS analysis
- (Win) Fixed the issue in which Prism occasionally crashed after switching to the results sheet of a Paired t Test analysis with data in the Mean, SD, and N format
- (Mac) Updated the default option for multiple comparisons correction test to be Tukey/Šidák for the two-way ANOVA analysis when using the multiple comparisons method "Compare cell means with others in its row and column"
Graphing-related Bug Fixes
- Fixed the issue in which the graph options of multiple variables graphs were not applied by the Magic command
- Fixed the issue in which it was impossible to enable graph and axis titles
- Fixed the issue in which the labels of additional ticks did not appear on multiple variables graphs with a logarithmic scale and custom settings for the axis range
- Fixed the issue in which the Y axis title was unexpectedly added to the graph after performing the Magic command if "YTitle" was previously deleted from the target graph
- Fixed the issue in which unnecessary decimals were shown for an axis numbering on a multiple variables graph using the Log 2 axis scale
- Fixed the issue in which the wrong major ticks appeared on the axis of multiple variables graphs if the source data contained fractional values
- Fixed the issue in which all default zig-zag lines with text appeared on the sheet with a multiple variables graph as a Z-type zig-zag line
- Fixed the issue in which it was impossible to open the entire list of the size or color legend groups on a multiple variables graph by dragging the resize knobs of the border
- Fixed the issue in which the PC Scores and Biplot graphs appeared empty after unfreezing them if previously the method for selecting principal components was changed in the parameters dialog for Principal Component Analysis
- Fixed the issue in which symbol labels disappeared on a multiple variables graph after saving the project in the .prism format and re-opening the file
- Fixed the issue in which resizing of rotated drawn objects worked incorrectly on multiple variables graphs
- Fixed the issue in which it was impossible to move comparison lines on a graph if all data was previously replaced by another data set in the source data table
- Fixed the issue in which the alert "Cannot add pairwise comparisons" did not appear after clicking the toolbar button if data was previously changed and the results sheet was blank
- Fixed the issue in which color assignments were applied incorrectly on a multiple variables graph after changing data in the source data table
- Fixed the issue in which data points outside of the axis range were unexpectedly displayed on grouped graphs
- (Win) Fixed the issue in Prism would crash while copying a text or drawing object on a graph and pasting it into the same graph
- (Win) Fixed the issue in which dots in a dotted line object to indicate errors on a graph overlapped
- (Win) Fixed the issue in which legends were unexpectedly enlarged and overlapped
- (Win) Fixed the issue in which the "Compact" feature for axis numbering did not work correctly for values smaller than 1 with a logarithmic scale and Antilog number format
- (Win) Fixed the issue in which a multiple variables graph with a segmented axis appeared corrupted if previously all data were cut, the graph was viewed, and new data added
- (Win) Fixed the issue in which the left Y axis disappeared from a multiple variables graph when any option was selected in the "Symbol size by" dropdown menu in the Inspector or symbol borders were applied and display DPI was 100%
- (Win) Fixed the issue in which the fill color between additional ticks disappeared after selecting gaps or reverse for axes on multiple variables graphs
- (Win) Fixed the issue in which graphs appeared blank after copying the layout sheet and pasting it into a Microsoft Office of Google document from a project with a custom results sheet title and chained results
- (Mac) Fixed the issue in which symbols, lines, and error bars were unexpectedly sent to the foreground of a graph instead of being behind the area fill of a different data set
- (Mac) Fixed the issue in which the formatting of column titles in a data table was not conveyed properly to legends of the associated graph
- (Mac) Fixed the issue in which color schemes were applied to a multiple variables graph in reversed order
- (Mac) Fixed the issue in which an empty placeholder was present on a multiple variables graph sheet instead of an embedded data table in the Magic step 2 dialog
- (Mac) Fixed the issue in which empty place placeholders were present on frozen multiple variables graph sheets instead of embedded data tables after saving and reopening a file
- (Mac) Fixed the issue in which an embedded data table was replaced by another one on a multiple variables graph sheet in the Magic dialog
- (Mac) Fixed the issue in which an embedded data table on a layout sheet with an unlinked graph appeared unexpectedly larger in a Prism project saved from one of the family of sheets
- (Mac) Fixed the issue in which objects appeared corrupted on multiple variables graphs in a .pzfx file with graphs using custom symbol sizes
- (Mac) Fixed the issue in which only a layout sheet appeared in the "Family" panel after adding a previously visited graph on the layout by dragging it onto the layout from the Navigator
Prism Cloud-related Bug Fixes
- Fixed the issue in which the alert "Nothing to publish" did not appear while publishing the Prism project with no sheets
- Fixed the issue in which an unexpected alert appeared on an attempt to open the Prism Cloud toolbar menu while the computer was offline
- Fixed the issue in which the "Publish to Prism Cloud" window was opened instead of an "Update" window after canceling a publish of a previously published project
- (Win) Fixed a typo in the "Nothing to publish" alert
- (Win) Fixed the issue in which Prism would crash when clicking the "Publish Project..." item if all projects were closed before invoking the "Prism Cloud" dropdown in the File menu
- (Win) Fixed the issue in which borders of violin plots appeared incorrectly on graphs published to Prism Cloud
- (Win) Fixed the issue in which dotted lines with arrows appeared with dashed line styles on multiple variables graphs published to Prism Cloud
- (Win) Fixed the issue in which imported images appeared blurry on multiple variables graph published to Prism Cloud
- (Win) Fixed the issue in which non-solid grid lines appeared slightly outside the graph plotting area if their thickness was greater than the thickness of the axes on graphs published to Prism Cloud
- (Win) Fixed the issue in which some items were dimmed in the "Prism Cloud" submenu of the File menu when no projects were open
- (Win) Fixed the issue in which the "Publish Project..." item appeared enabled in the File menu when no projects were opened
- (Win) Fixed the issue in which grouped graphs with bars, individual values, and segmented axes appeared corrupted when published to Prism Cloud
- (Win) Fixed the issue in which Prism would crash while clicking on the "Account Settings" option in the Prism Cloud Account preferences if there were no open projects
- (Win) Fixed the issue in which text objects disappeared from a graph layout published to Prism Cloud after performing an update
- (Win) Updated the behavior of the "Publish to Prism Cloud" toolbar button to be disabled/dimmed if there were no open projects
- (Mac) Fixed the issue in which Prism would freeze while publishing particular files to Prism Cloud
- (Mac) Fixed the issue in which imported images with transparent backgrounds appeared with a black background on a graph sheet published to Prism Cloud
- (Mac) Fixed the issue in which part of the values were missing from an inserted Excel object on a graph or layout sheet published to Prism Cloud if the project was originally created using Prism Win
- (Mac) Fixed the issue in which the graph based on the results sheet appeared blank/out of date in Prism Cloud if the initial data were changed prior to publishing
Other Bug Fixes
- Fixed the issue in which Prism would crash while saving a file in the .pzfx format with thousands of row titles in a single data table
- Fixed the issue in which Prism would crash after checking the "Connecting lines" checkbox on the output tab of the Principal Component Analysis parameters dialog and clicking the OK button if previously the PC Scores graph was frozen
- Fixed the issue in which Prism would crash while changing the location of numbering for the Y axis when the X axis was segmented in a multiple variables graph
- Fixed the issue in which Prism would crash while switching to a graph generated by Principal Component Analysis or Cox proportional hazards regression if previously all data was cut in the source data and any graph was previously frozen
- Fixed the issue in which Prism would crash while switching to any sheet after performing the Undo operation for changing the kind of data table
- Fixed the issue in which Prism would crash while switching to the results sheet of a duplicated family after performing the Undo operation for deleting values in the data table
- Fixed the issue in which Prism would freeze while working with a saved project with results of the "Cox proportional hazards regression" analysis after changing the parameters of the analysis
- Fixed the issue in which values of the data table were changed after inserting a new column if Undo operation was performed for the "Create series" action
- Fixed the issue in which a custom color scheme did not appear in the Color Scheme dropdown menu in the "Data" tab of the Inspector
- Added the auto-recovery procedure for the case when the number of replicates in the sheet.json and actual CSV file format were different such that Prism no longer crashes when adding values to the associated data table
- Fixed the issue in which Prism would crash while switching between or duplicating sheets in a project with inconsistent data structures
- (Win) Fixed the issue in which Prism would crash while pasting an embedded data table with row titles from a multiple variables graph to any other kind of graph
- (Win) Fixed the issue in which Prism would crash while recalculating the Simple linear regression analysis with changed parameters after canceling the switch to Nonlinear regression by using the "More choices..." button
- (Win) Fixed the issue in which Prism would crash while performing multiple Undo operations then creating a new info sheet
- (Win) Fixed the issue in which an unexpected copy of a graph was generated while performing "Remove baseline" or "Normalize" analysis from the "Baseline-corrected" graph
- (Win) Fixed the issue in which the Prism installer did not define the Prism icon for the .prism file type after performing silent installation
- (Win) Fixed the issue in which the Prism logo on the toolbar was cut when resizing the document window
- (Win) Fixed the issue in which the "Send Email" command offered the .pzf format instead of the .prism format
- (Win) Fixed the issue in which dropdown menus for smaller and larger symbol sizes for multiple variables graphs were enabled in the Inspector and Format graph dialog if auto-size was checked
- (Win) Fixed the issue in which empty columns with the name "Data Set - [letter]" appeared in the data table with an updated link in the re-opened project which led to showing the Compatibility Checker dialog with critical incompatibilities
- (Win) Fixed the issue in which highlighted cells in the results sheet were not displayed or updated in the gallery thumbnails if there were several analysis sheets
- (Win) Fixed the issue in which only one family was saved in the .prism format while attempting to save several selected families via the "Save Family as" command
- (Win) Fixed the issue in which options for "Lines/arcs" and "Boxes/ovals border" objects were not saved in the define color scheme dialog
- (Win) Fixed the issue in which the alert "This sheet is damaged and cannot be viewed" appeared after inserting an embedded table and performing Undo/Redo operations on a layout with a multiple variables graph
- (Win) Fixed the issue in which unlinked graphs and imported images disappeared from a duplicated layout sheet after saving and reopening the project
- (Win) Fixed the issue in which Prism projects in the .prism file format could not be searched for in Windows Explorer
- (Win) Reduced CPU usage, and fixed the memory leak and UI corruption issues while dragging and hovering on a graph thumbnail in gallery mode
- (Mac) Fixed the issue in which Prism would crash while duplicating the family of the Transform results sheet with a standard function created from the Transform Concentrations analysis
- (Mac) Fixed the issue in which it was impossible to enter negative values for the minimum axis range value in the Inspector for multiple variables graphs
- (Mac) Fixed the issue in which it was impossible to open a .prism file with a "Transform" results sheet which was created by the Transform Concentrations analysis
- (Mac) Fixed the issue in which Prism would crash upon opening a file with a corrupted document.json file
- (Mac) Fixed the issue in which Prism would crash upon deleting a graph sheet that contained an embedded table and linked with a layout
- (Mac) Fixed the issue in which Prism would crash upon opening a file with corrupted text in row titles of a data table
- (Mac) Fixed the issue in which Prism would crash upon switching to a newly created graph generated by the Principal Components Analysis if the previous results sheet with frozen graphs was removed by performing the Undo operation
- (Mac) Fixed the issue in which Prism would crash while switching to the frozen "PC Scores" graph sheet generated by Principal Components Analysis if the color/size variables were removed from the data table
- (Mac) Fixed the issue in which "Infinity" appeared in the "Maximum" and "Starting At" fields for the logarithmic scale of a multiple variables graph after clicking arrows in the "Minimum" control in the Inspector
- (Mac) Fixed the issue in which a simple line appeared instead of a line with double arrows in the Direction dropdown menu int he Format Object dialog for drawing objects
- (Mac) Fixed the issue in which color palettes for "Symbol Border" and "Symbol Labels" were missing in the Inspector on macOS 12 and earlier
- (Mac) Fixed the issue in which constants were displayed as zeroes in the "Parameters: Transform" dialog after saving and reopening a .pzf project
- (Mac) Fixed the issue in which an incorrect color scheme preview was shown in the dropdown menu of the Inspector
- (Mac) Fixed the issue in which indents on the Info sheet were not saved
- (Mac) Fixed the issue in which it was impossible to separately uncheck X column and Column titles in the "Format embedded table" dialog for a table pasted on a multiple variables graph sheet
- (Mac) Fixed the issue in which pasted linked data lost its link after duplicating the data table sheet in a project that was saved and then reopened
- (Mac) Fixed the issue in which the alert "File is damaged" appeared and all multiple variables graphs were lost upon opening a project if all graphs were previously resized from the gallery
- (Mac) Fixed the issue in which the "Vertical Text (Up)"/"Vertical Text (Down)" commands did not work int he Contextual menu invoked for vertical brackets with asterisks on a multiple variables graph
- (Mac) Fixed the issue in which the Data tab of the Inspector appeared empty after the X or Y axis variable was deleted or changed to categorical and a new variable assigned
- (Mac) Fixed the issue in which the order of analyses displayed in the "Tabulate which analysis?" section of the "Analyze Data" dialog was incorrect when invoked for the Monte Carlo analysis
- (Mac) Fixed the issue in which the number of selected parameters was shown in the Monte Carlo parameters dialog while no parameter was selected after the "Duplicate family" action was applied in projects saved in .pzf/.pzfx format
- (Mac) Fixed the issue in which Prism did not relaunch automatically into Viewer Mode after clicking the "Switch to Prism Viewer" button
- (Mac) Renamed the contextual menu on a graph from "Color Scheme" to "Change Color Scheme"
- (Mac) Fixed the issue in which .prism files were unexpectedly marked as "Edited" after opening
- (Mac) Fixed the issue in which text formatting was lost after copying column titles in a data table
Analyze, graph and present your scientific work easily with GraphPad Prism. No coding required.