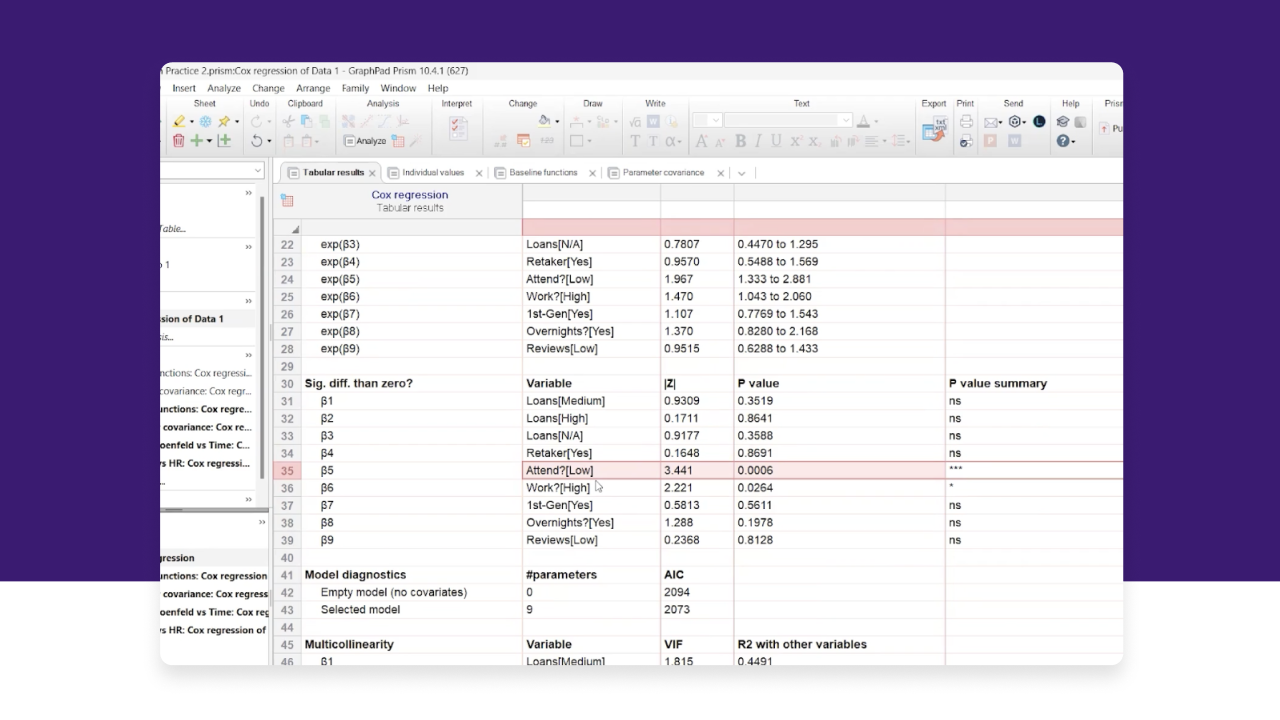
Reformatting data before every analysis costs time you don't have. Prism's Multiple Variables table eliminates that step, keeping your raw data, derived variables, and statistical analyses all in one place.
This six-part series walks you through features in the context of real workflows. In this guide, you will learn how to:
- Create calculated variables using spreadsheet-style formulas directly inside the data table
- Run a t test from a Multiple Variables table using a per cent-change calculated variable
- Perform Multifactor ANOVA with a log-transformed response variable
- Build a full qPCR delta Ct pipeline - dCt, ddCt, and fold change without leaving Prism
- Run Kaplan-Meier survival analysis by assigning time, event, and grouping columns directly
- Fit dose-response curves and calculate IC50 values using sigmoidal nonlinear regression
What is the Multiple Variables Data Table
The Multiple Variables data table, available in Prism Pro or Enterprise plans, is Prism's most flexible data structure. Each row is an observation, each column is a variable, and text-based categorical variables are supported directly without any numeric coding.
Prism 11 expands what's possible from this single table type with two powerful additions available in Prism Pro and Enterprise plans.
First, Calculated Variables let you create new variables from spreadsheet-style formulas directly inside the table. Type an equals sign in any empty column to start. Results update automatically whenever your source data changes, and your original data stays untouched. Second, Classic Analyses from Multiple Variables Tables means you can now run t tests, nonlinear regression, Multifactor ANOVA, and Kaplan-Meier survival analysis directly by assigning variable roles - no reformatting or table-switching required.
This six-part series walks through both features in the context of real workflows: from a basic per cent-change t-test through qPCR delta-Ct pipelines, multifactor ANOVA, Kaplan-Meier curves, and dose-response modeling.
Each video follows the same pattern - enter or import data, add a calculated variable, run the analysis, interpret the output, so the skill transfers directly from one workflow to the next.
Ready to try it? Start your free 30-day trial.
How to Create Calculated Variables
Prism's Calculated Variables feature lets you create new variables from spreadsheet-style formulas directly inside a Multiple Variables table - no separate analysis sheets, no Excel round-trips.
Select any empty variable column and type an equals sign to start: Prism supports simple operations like ratios and unit conversions as well as multi-function chains. Unlike spreadsheet formulas that work cell-by-cell, formulas here operate on entire variables at once and recalculate automatically whenever source data changes. Each formula includes a help card linked to the Prism user guide. By the end of this video, you'll understand how to keep all your derived variables inside a single, clean project file.
WHAT YOU'LL LEARN
- Start a formula with the equals sign in any empty variable column
- Build simple and chained calculations directly inside the data table
- Understand how formulas update live when source values change
How to Run a T Test
In Prism, you can run a t-test directly from a Multiple Variables table without restructuring your data or switching table types.
This video opens a Multiple Variables table with baseline and follow-up measurement columns, adds a calculated variable column for percent change using an inline formula, then launches an unpaired t-test directly from the table with the calculated column as the outcome.
The results sheet returns the p-value, confidence interval, and effect size in one step. Finally, one raw value is edited on-screen to show the full live chain: the calculated column recalculates instantly, and the t test results update accordingly.
WHAT YOU'LL LEARN:
- Add a percent-change calculated variable column from scratch
- Understand a calculated variable as a step in a statistical pipeline, not a standalone feature
- Run a t-test from a Multiple Variables table end to end
How to Run Multifactor ANOVA
Prism's Multifactor ANOVA lets you handle any number of factors. From a single Multiple Variables table, with no need to restructure data as you add or remove factors.
This video imports a multi-factor dataset, then uses a calculated variable to log-transform the response, a common normalization step before running ANOVA, to meet model assumptions. The two-way ANOVA is launched from the table, factors are specified, and the interaction plot and post-hoc results are reviewed together. A brief section explains when to use Multifactor ANOVA instead of a t-test.
WHAT YOU'LL LEARN
- Use a calculated variable to transform the response.
- Perform a two-way ANOVA from a Multiple Variables table.
- Know when to move from a t-test to ANOVA and how to interpret the interaction plot
How to Run qPCR Delta Ct Analysis
You can calculate qPCR delta Ct, ddCt, and fold change entirely inside a Prism Multiple Variables table using Calculated Variables - no external spreadsheet required.
Raw Ct values are imported with one column per gene. A first calculated variable computes dCt (target Ct minus reference Ct). A second column computes ddCt by referencing the mean of the control group's dCt values directly inside the formula, demonstrating how to call a group-level summary statistic from within a calculated variable. A third column converts ddCt to fold change using 2^(−ddCt). Enter data from a dose-response experiment and then run on the fold change column to compare conditions.
WHAT YOU'LL LEARN:
- Build a multi-step calculated variable pipeline (dCt → ddCt → fold change) inside a single table
- Reference group summary statistics (means) directly inside a formula
- Move from raw Ct values to a statistical comparison without leaving Prism
How to Run Kaplan-Meier Survival Analysis
Prism lets you run Kaplan-Meier survival analysis directly from a Multiple Variables table by assigning time, event, and grouping columns to analysis roles - no separate Survival table needed.
This video imports a survival dataset with time, event/censoring status, group assignment, and covariates into a single Multiple Variables table, adds a derived covariate using a calculated variable where needed, then launches Kaplan-Meier, assigns the columns, and reviews the survival curves, median survival table, and log-rank test. A reference line at Y=50 is added to the curve to visually connect the plot to the median survival values in the results table. The video closes with a series recap showing the consistent import → calculate → assign → analyze pattern across all six workflows.
WHAT YOU'LL LEARN:
- Run a Kaplan-Meier analysis from a Multiple Variables table by assigning time and event columns
- Add a Y=50 reference line to connect the survival curve to the median survival table
- See the consistent import → calculate → assign → analyze pattern across all five workflows
How to Analyze Dose-Response Data
In Prism, you can fit dose-response curves and calculate IC50 values directly from a Multiple Variables table - no XY table required.
This video enters concentration and percent response values for two cell lines (HEK293 and HeLa), then adds a calculated variable column for log10(concentration), explaining why log-transforming the X axis is standard practice: it linearizes the sigmoid curve and stabilizes EC50 estimation. The categorical cell-line column is automatically recognized as a grouping variable, not a numeric variable to fit. Sigmoidal nonlinear regression (variable slope) is launched from the table with the log-transformed X column as the independent variable, producing separate fitted curves and EC50 values per cell line. The video closes with a live edit showing the log column and fitted curves update instantly when a raw concentration value is changed.
WHAT YOU'LL LEARN:
- Enter data from a dose-response experiment into a Multiple Variables table with a categorical grouping column
- Add a log10 transformation as a calculated variable and understand why it matters for curve fitting
- Run sigmoidal nonlinear regression directly from the table to get EC50 values per group
Frequently Asked Questions
What is the Multiple Variables data table in Prism?
The Multiple Variables table is Prism's most flexible data structure. Each row represents a single observation and each column represents a variable. Unlike other Prism table types, it supports text-based categorical variables directly, with no numeric coding required.
How is the Multiple Variables table different from a Grouped table?
A Grouped table is designed for summarized or replicate data organized by group, and is best suited for bar graphs and grouped analyses. The Multiple Variables table holds raw observational data where each row is one subject or sample, making it better suited for regression, survival analysis, and multi-factor ANOVA.
Can I run ANOVA without reformatting my data into a different table?
Yes. From Prism 11 onwards you can run Multifactor ANOVA, t tests, nonlinear regression, and Kaplan-Meier survival analysis directly from a Multiple Variables table by assigning variable roles - no table-switching or data restructuring needed.
What are Calculated Variables and how do they work?
Calculated Variables let you create new columns from spreadsheet-style formulas directly inside the Multiple Variables table. Type an equals sign in any empty column to start. Results update automatically whenever your source data changes, keeping your entire workflow inside a single Prism project file.
Do I need Prism Pro to use these features?
Yes. Calculated Variables and Classic Analyses from Multiple Variables tables (t tests, ANOVA, nonlinear regression, Kaplan-Meier) require a Prism Pro or Enterprise plan. Check your plan or upgrade here.
Can I calculate IC50 and fit dose-response curves from a Multiple Variables table?
Yes. You can enter concentration and response data, add a log10 transformation as a calculated variable, and run sigmoidal nonlinear regression directly from the table to get separate fitted curves and EC50/IC50 values per group.
Can I do qPCR analysis entirely inside Prism?
Yes. You can build a full delta Ct pipeline- dCt, ddCt, and fold change - using Calculated Variables inside a single Multiple Variables table, with no external spreadsheet required.
Ready to unlock the full Multiple Variables workflow? Compare plans or start your free trial
Visit our Resources Center to learn and master data analysis, statistics and graphing in Prism with our guides, videos and tools.