- Prism
FEATURES
Analyze, graph and present your workComprehensive analysis and statisticsElegant graphing and visualizationsShare, view and discuss your projectsLatest product features and releasesPOPULAR USE CASES
- Enterprise
- Resources
- Support
- Pricing
Course Content
Select and Transform
This video shows how Prism’s data transformation tools simplify analyzing research and student data—transforming p-values, calculating stats, removing baselines, and selecting subsets—to quickly visualize and explore results without needing spreadsheets.
LENGTH 11 Minutes
Formulas in Columns
Learn how to create calculated variables directly in your Multiple Variables table, no extra spreadsheets needed.
LENGTH 6 Minutes
Complex Data Structures
Learn how to use Prism’s extract and rearrange tool to quickly filter, organize, and analyze complex datasets for t-tests, ANOVA, and contingency tests—saving time and simplifying advanced data analysis.
LENGTH 10 Minutes
Sample Size and Power Analysis
This tutorial introduces Prism's power analysis and sample size estimation tools. It walks through calculating sample size based on desired power, effect size, and significance level for t tests and ANOVAs, using real data and customizable options.
LENGTH 9 Minutes
Hierarchical Clustering Analysis
This video shows how to use hierarchical clustering in Prism to group data, visualize dendrograms, and identify clusters using concepts like Euclidean distance and silhouette plots.
LENGTH 12 Minutes
K-means Clustering Analysis
In this video, K means clustering in Prism groups data into clusters and reveals patterns using silhouette plots and heat maps for better visualization.
LENGTH 12 Minutes
Cox Regression
This tutorial shows how to use Prism’s Cox proportional hazards regression to explore survival outcomes with multiple categorical predictors, estimate significance, and visualize effects using hazard ratios and parameter covariance for deeper insights.
LENGTH 8 Minutes
Multiple Linear Regression
Learn multiple linear regression in Prism: predict outcomes, check fit, test significance, assess residuals, and avoid multicollinearity.
LENGTH 13 Minutes
Multiple Logistic Regression
Use Prism’s multivariable tools to explore multiple logistic regression with Titanic data. Learn to predict survival using binary and continuous variables, interpret odds ratios, ROC curves, model fit, and row-level prediction accuracy.
LENGTH 8 Minutes
Poisson Regression
Use Poisson regression in Prism to model non-normal, count-based outcomes like review attendance. Learn to assess predictors, interpret log-scale coefficients, handle multicollinearity, and evaluate model fit with residuals and predicted values.
LENGTH 11 Minutes
Principal Component Analysis (PCA)
Learn more about this powerful tool used for exploratory analyses with large datasets
LENGTH 6 minutes
Dose Response
This video shows how to set up dose-response curves in GraphPad Prism, including data entry, log transformation, curve fitting, and refining IC₅₀ values for accurate cancer drug response analysis.
LENGTH 11 Minutes
Recommended Resources

VIDEO SERIESAdvanced Graphing Techniques
Watch this series to master advanced graphing tools
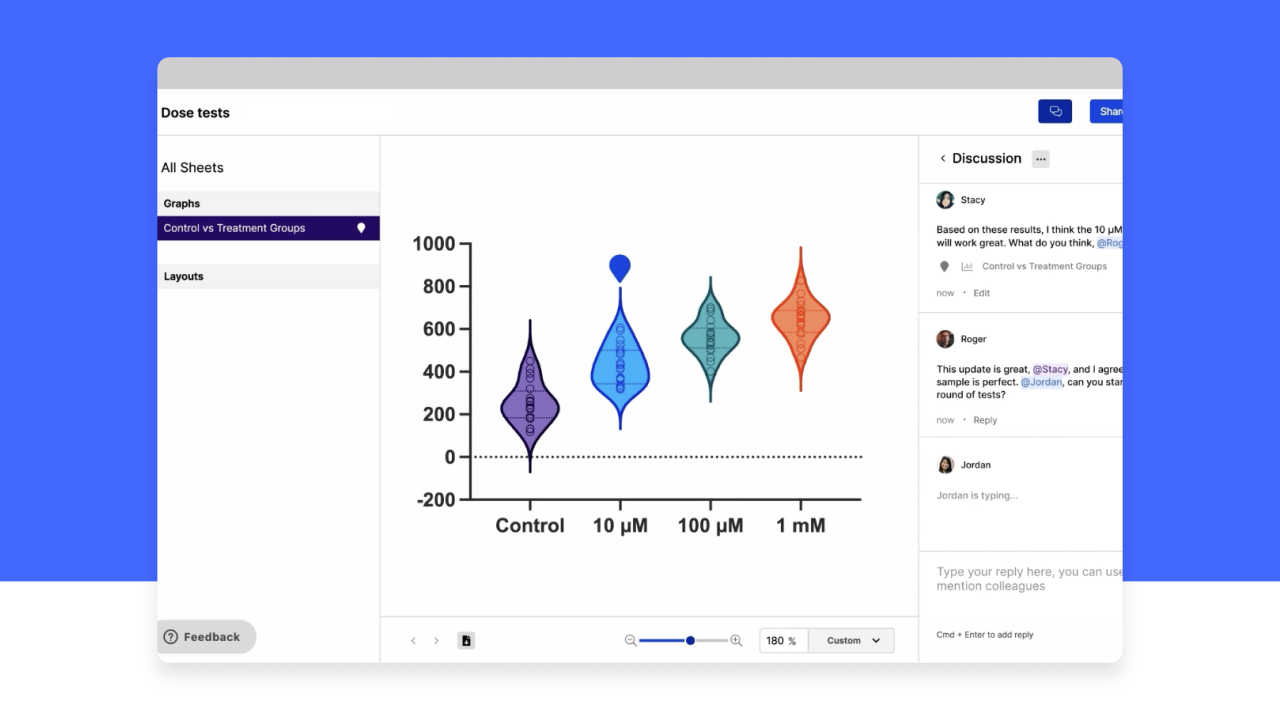
VIDEO SERIESCollaboration in Prism Cloud
Everything you need to collaborate effectively in Prism Cloud
Analyze, graph and present your scientific work easily with GraphPad Prism. No coding required.