
-
Prism
FEATURES
Analyze, graph and present your workComprehensive analysis and statisticsElegant graphing and visualizationsShare, view and discuss your projectsLatest product features and releasesPOPULAR USE CASES
- Enterprise
- Resources
- Support
- Pricing
Outlier calculator
Outliers make statistical analyses difficult. This calculator performs Grubbs' test, also called the ESD method (extreme studentized deviate), to determine whether the most extreme value in the list you enter is a significant outlier from the rest.
Simply copy and paste your dataset into the calculator. Learn more about the principles of outlier detection and exactly how this test works in the description below the calculator.
What are outliers?
An outlier is a data point on the extreme end of your dataset. It could be very large or very small, but it is abnormally different from most of the other values in your dataset. There are many reasons for outliers, and they can show up in any kind of study.
It's best to think about outliers as points of interest, and what to do with them isn't straightforward. They could be as simple as data entry errors or the outliers could themselves be an important research finding. That's quite a range, and it could be anywhere in between, too! Use our outlier checklist to help decide what to do in your case.
What is Grubbs' Test?
Grubbs' Test, or the extreme studentized deviant (ESD) method, is a simple technique to quantify outliers in your study. It is based on a normal distribution and a test statistic (Z) that is calculated from the most extreme data point. The test statistic corresponds to a p-value that represents the likelihood of seeing that outlier assuming the underlying data is Gaussian.
Read more about Grubbs' test and its interpretation.
How to use the Outlier Calculator
First, choose the significance level (alpha) where an outlier will be detected. The most common choice is .05.
Then copy and paste your data into the right side. Be sure to enter one data point on each line. Do not use a long list separated by commas!
Click calculate to view the results, including basic descriptive statistics and, if there is one, which datapoint was identified as an outlier.
Performing Grubbs' tests? We can help.
Sign up for more information on how to perform Grubbs' tests and other common statistical analyses.
Interpreting results
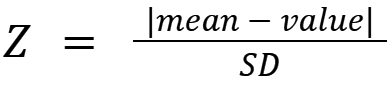
Interpreting results from Grubbs' Test is straightforward. Once the value of Z is calculated for each data point, Grubbs' considers the largest value of Z in the dataset and calculates its P value.
The P value is interpreted like normality testing: If the P value corresponding to this Z is less than the alpha value chosen (such as .05), it is considered a significant outlier. The results page will then mark this data point as an outlier. If that P value is greater than alpha, the test concludes there is no evidence of an outlier in your dataset.
Notice that although the Grubbs' Test only determines if the most extreme value is an outlier, the entire dataset is used to calculate the mean and standard deviation for the test.
Limitations of Grubbs' Test
There are two main assumptions of Grubbs' Test that limit its practical usage.
First, Grubbs' only looks for one outlier in the dataset. It gives a general answer to the question "Is there at least one outlier in this data?". This has a couple blindspots:
- If you wish to see if there is more than one outlier after the first test, it is not appropriate to remove the first outlier and run Grubbs' again to look for more.
- If there are multiple outliers close together, these "neighbors" can result in Grubbs' not labeling either an outlier. This is called masking.
The second main limitation is that Grubbs' assumes the data was sampled from a normal (or gaussian) distribution. However, it's rare to observe "normal" data in the world. For example, in the biological sciences, data often follows a lognormal distribution, which looks at first to have obvious outliers if the pattern is not recognized appropriately. See our example that uses Grubbs' Test on a lognormal distribution.
There are additional outlier identification tests available in Prism. The most popular alternative is called ROUT. See a comparison of these two methods here.
Graphing outliers
Outliers lend themselves to graphics perhaps more than any other aspect of statistics. Scatter plots, box plots, and violin plots are common ways to see where your dataset clumps together and which values are the extremes.
That said, visual inspection of outliers is still tricky. If done arbitrarily the human eye may conclude that any extreme value is an outlier, which is not always the case!
This calculator does not include a chart for outliers, but Prism allows you to create fully-customizable charts and graphics of all kinds.
Next steps
Enjoying this calculator? Prism offers more capabilities for outlier detection, including methods like Grubbs' Test, ROUT, and more. We offer a free 30-day trial of Prism and its publication-ready graphic creation.
Analyze, graph and present your scientific work easily with GraphPad Prism. No coding required.