- Prism
FEATURES
Analyze, graph and present your workComprehensive analysis and statisticsElegant graphing and visualizationsShare, view and discuss your projectsLatest product features and releasesPOPULAR USE CASES
- Enterprise
- Resources
- Support
- Pricing
Course Content
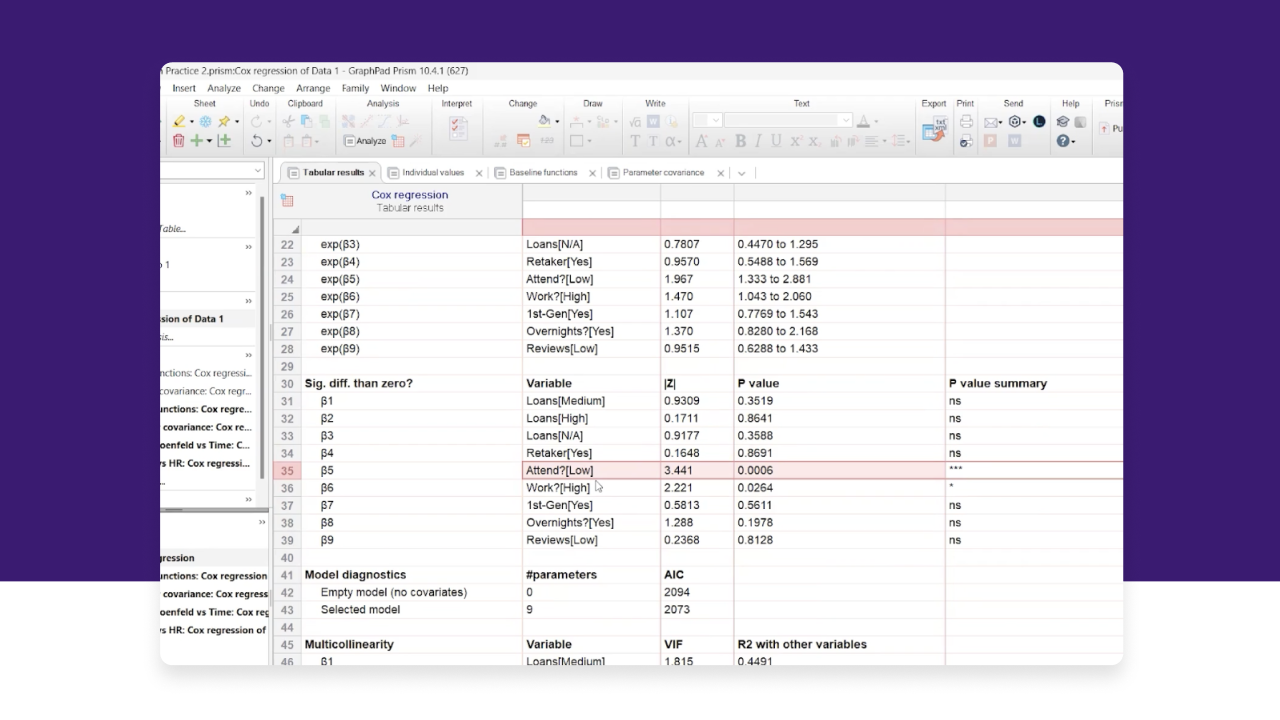
Confidence Ellipses and Convex Hulls
This video shows how to use GraphPad Prism’s confidence ellipses and convex hulls to visualize data spread and group differences in scatter plots, using student performance data categorized by attendance and work commitments, with no coding required.
LENGTH 10 Minutes
Heatmaps
Learn to create and customize heat maps in Prism using grouped and multiple variable data. Explore summary options like mean, count, and standard deviation to visualize patterns and relationships, ideal for Likert and continuous data analysis.
LENGTH 8 Minutes
Best Practices for Creating Graphs
This tutorial demonstrates best practices for creating effective bar graphs and heat maps. It covers formatting tips, color schemes, axis customization, error bars, and annotating data, useful for visualizing exam scores and Likert-scale responses.
LENGTH 8 Minutes
Pairwise Comparisons and Compact Letter Display
In this video you will learn t test and ANOVA basics, best practices for graphing, and effective ways to communicate statistical significance
LENGTH 6 Minutes
Interactive Graph Inspector
This video explores how to use the Graph Inspector in Prism for multivariable data. Learn to interactively swap axes, adjust styles in real time, and explore variable relationships—perfect for dynamic visual analysis of large datasets.
LENGTH 9 Minutes
Automatic Number at Risk Table (Kaplan-Meir Survival Analysis)
This tutorial showcases two new survival analysis features in Prism. These updates enhance clarity and save time for publication-ready survival plots.
LENGTH 5 Minutes
TeX Rendering of Best-Fit Model
In this video you will learn how to insert universal TeX formats into figures, customize equations, and streamline clear, professional graph annotations.
LENGTH 6 Minutes
Understanding Symbol Sizes on Multiple Variables Graphs
Learn how to use symbol sizes in Prism to represent multiple variables. Explore continuous and categorical sizing, Likert scales, and ways to manage outliers for clearer, more effective data visualization.
LENGTH 11 Minutes
Recommended Resources
VIDEO SERIESData Import & Analysis
Watch this series to strengthen your analytical approach
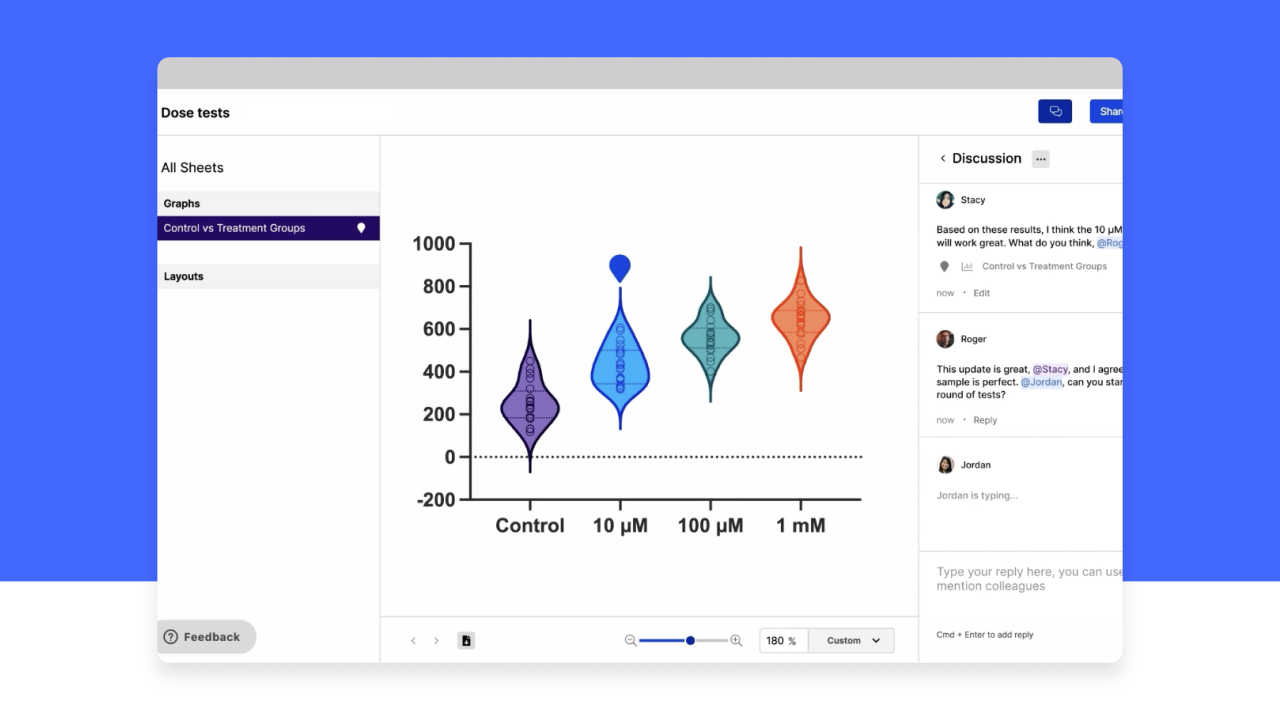
VIDEO SERIESCollaboration in Prism Cloud
Everything you need to collaborate effectively in Prism Cloud
Analyze, graph and present your scientific work easily with GraphPad Prism. No coding required.