




One-Way ANOVA and Nonparametic Analyses
Prism offers four ways to compare three or more sets of data that have been grouped by a single factor or category. The correct test depends upon (a) whether observations are matched by subject at each factor level and (b) whether you assume that measurements are drawn from a population that follows a normal (Gaussian) distribution.
|
Assume Gaussian distribution?
|
|||
|
Yes — Parametric test
|
No — Nonparametric test
|
||
| Repeated measures? |
No — data NOT matched by subject |
Regular ANOVA
|
Kruskal-Wallis test
|
|
Yes — data matched by subject |
Repeated-measures ANOVA
|
Friedman test
|
|
You don't have to memorize these assumptions; if you answer the questions above for your experiment, Prism will pick the correct test for you.
Following ANOVA, Prism can perform the Tukey, Bonferroni, Sidak, Holm-Sidak, Newman-Keuls, or Dunnett's post test. Following nonparametric analysis, Prism can perform Dunn's post test.
In this step-by-step example, we'll demonstrate a simple repeated-measures ANOVA followed by the Tukey post test, but we'll point out other options as we go. To learn more about analysis of variance, consult the ANOVA sections of the Statistics Guide. If you have only two data groups to compare, try the step-by-step example on t tests. If you have more than two groups, but the data are grouped by two factors, refer to step-by-step on two-way ANOVA.
Enter the Data
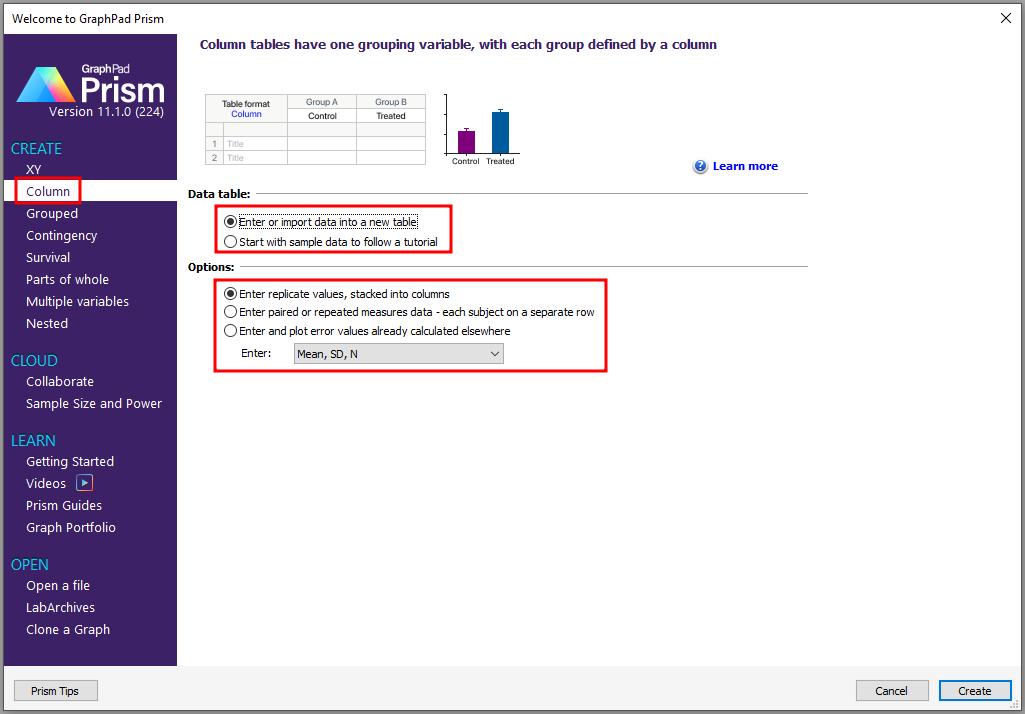
When you launch Prism, the Welcome to Prism dialog appears. Choose to Create a new Column data table.
In the lower half of the Welcome dialog, tell Prism how to format your data table. Select the option to enter replicate values, stacked into columns.
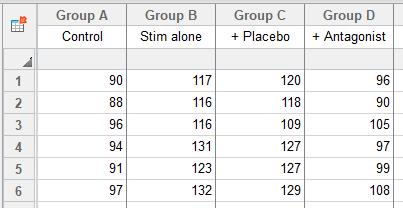
Suppose that you measure the mean blood pressures of six animals during a pre-treatment control period, then while administering a neural stimulus alone, in the presence of a placebo drug, and in the presence of a putative antagonist designed to inhibit the effect of neural stimulation. The data are matched, since each treatment is repeated in succession with each subject. Enter the data as shown below:
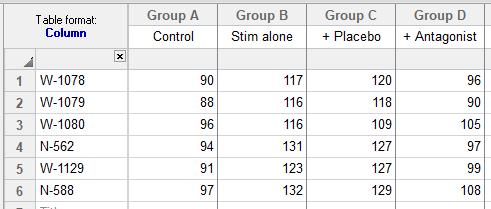
Generally, you'll omit the row titles column from your table when you intend to do one of the statistical analyses, but you don't have to. In this example, where treatments are repeated in the same subjects, you might find it useful to include a row titles column simply to keep track of subject identities. Below is a table formatted for text in the row titles column, into which animal tag numbers are then entered:
You could also format your table for entry of mean, standard deviation or standard error, and N.

With this format, however, you can't perform a repeated-measures or nonparametric analyses, which require raw data.
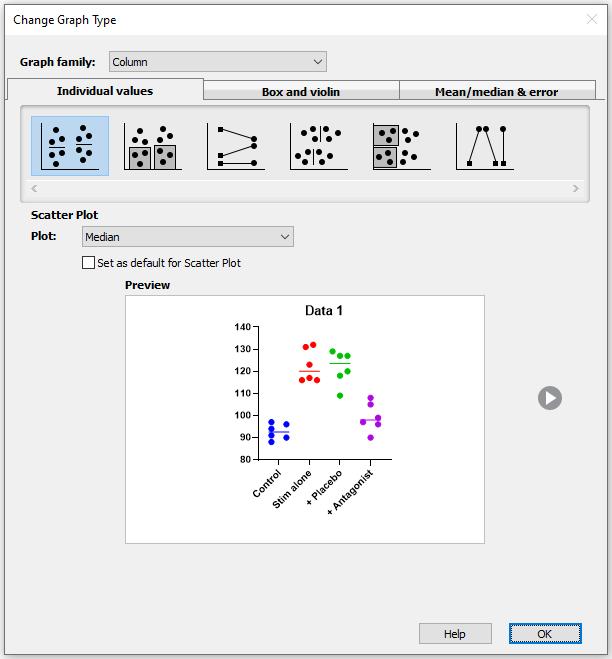
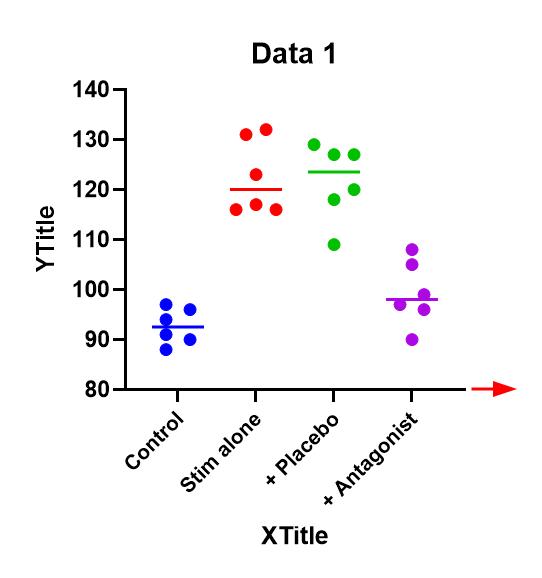
Click on the Graphs section of the Navigator (left) panel to view the column scatter plot that Prism has produced automatically. Choose from many different plots within each tab (individual values, box and violin, or mean/median & error).
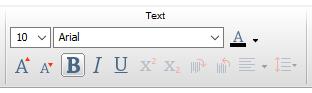
If the baseline labels overlap, you can either reduce the font size of the labels...
...or select and drag to elongate the baseline.
If you'd prefer, you can view a column bar graph instead by choosing Change... Graph Type... and choosing a Column bar graph from the Mean/median & error tab.
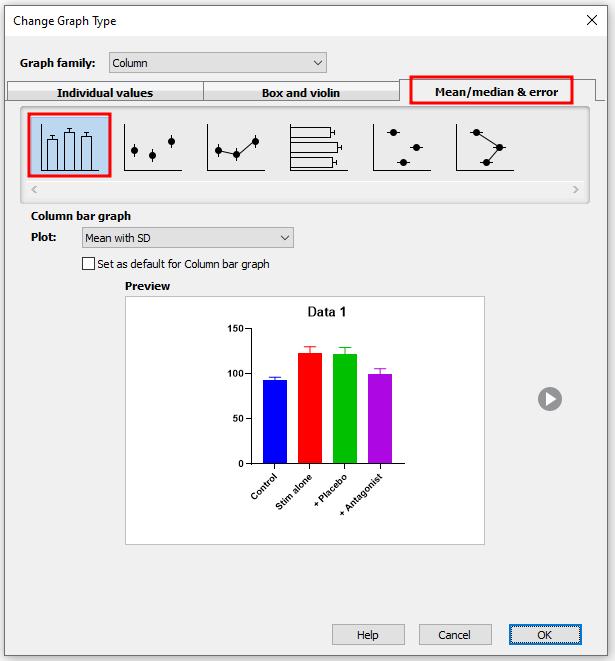
The error bars on this graph will show standard deviation (SD) rather than standard error (SEM) if that is the default setting in Prism. You can easily change this by using the dropdown box next to the Plot option.
Note that this is a column bar graph. Our other step-by-step articles will help you to understand the distinction between a column bar graph and a regular bar graph.
Choose the Analysis and the Options
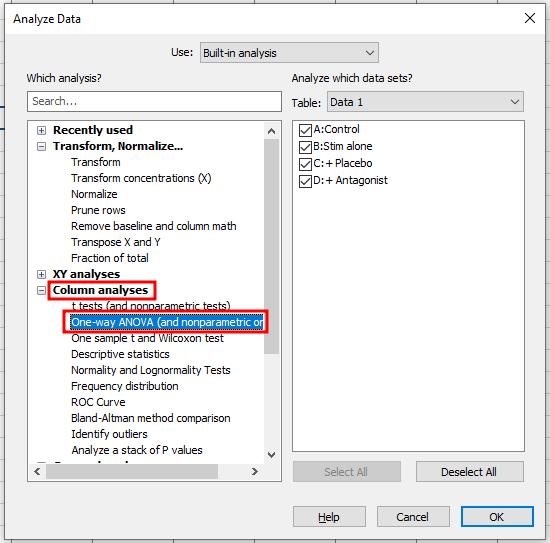
Click on the Data Tables section to return to the data table. Click Analyze. In the Analyze Data dialog, select Column analyses and One-way ANOVA (and nonparametric or mixed):
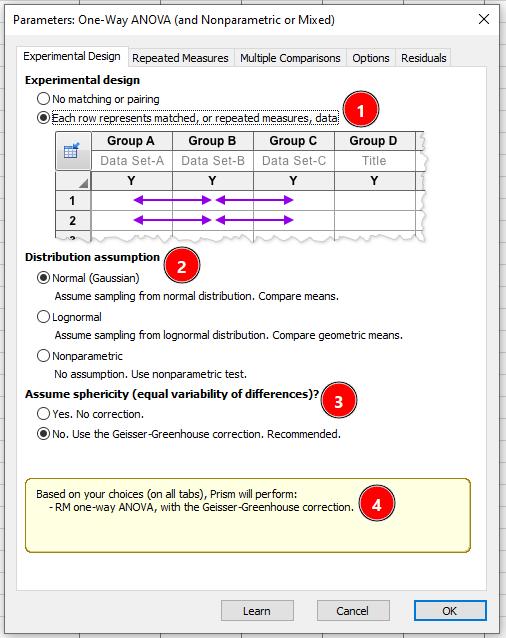
In the Parameters: One-Way ANOVA dialog box, you have multiple options to help you select the appropriate test. Refer to the screenshot below for an explanation of each option on the Experimental Design tab. Option 1 lets you decide whether your data has repeated measures or not. Option 2 guides you through the different distribution assumptions possible for this analysis (normal, lognormal, or nonparametric). Option 3 prompts you on whether to assume sphericity within your data (see this page in the Statistics Guide for more details on sphericity). The yellow box (4) summarizes your chosen options as you go.
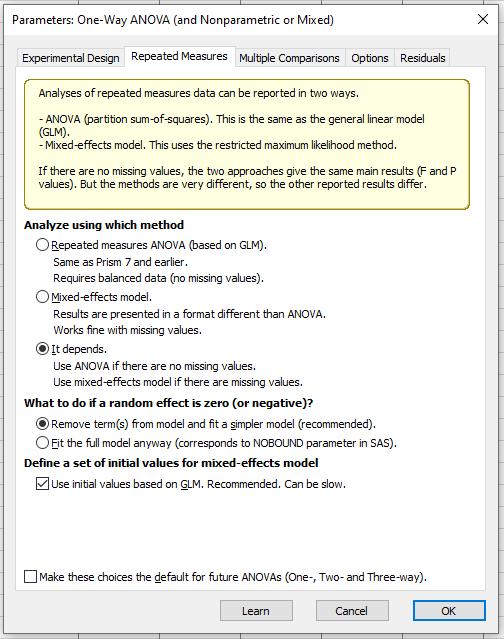
The Repeated Measures tab contains more options for how to analyze your data (conventional repeated measures, mixed effects mode, or let Prism decide).
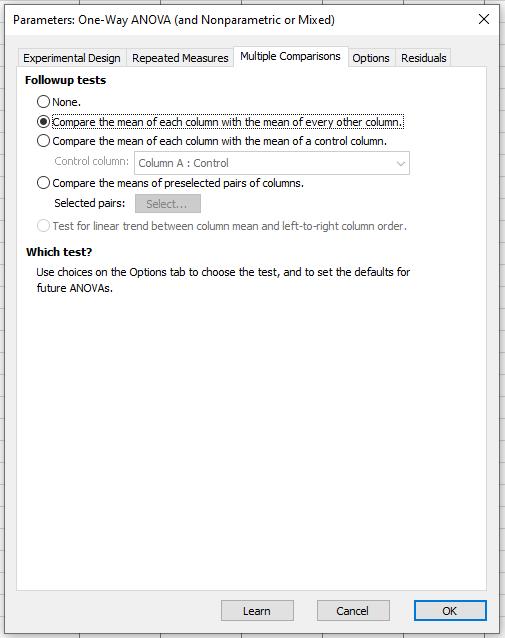
Next, the Multiple Comparisons tab provides options including compare all columns, compare to a control, and compare preselected columns.
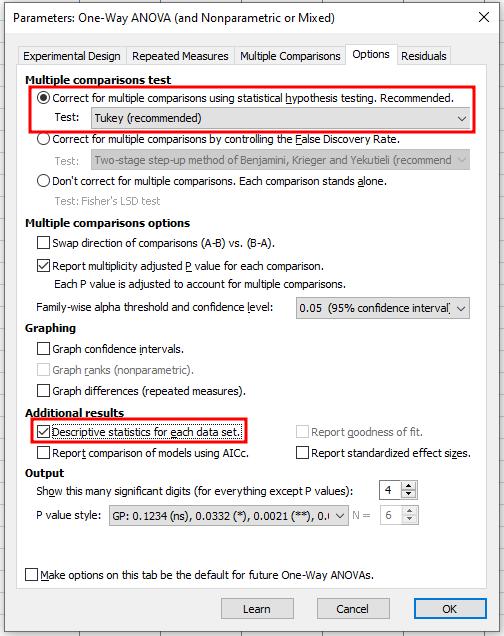
The Options tab lets you decide what approach to multiple comparisons you would like to take (Tukey, Bonferroni, etc.). For this example, we select Tukey and check the box for the optional table of descriptive statistics.
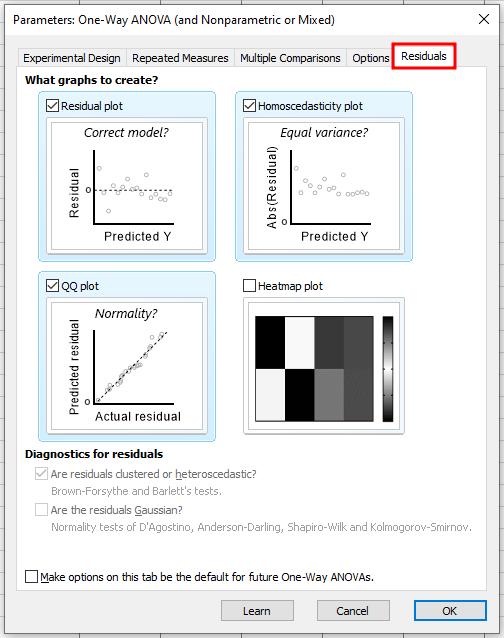
The final tab, Residuals, offers many diagnostic plots and tests.
View the Results
When you leave the Parameters dialog by clicking OK, Prism runs the analysis. Because of the options we chose, the Results page for this example consists of three tabs (ANOVA results, multiple comparisons, and descriptive statistics).
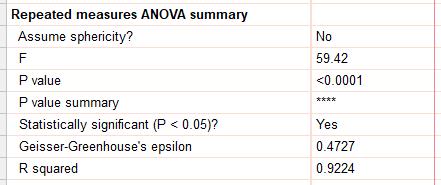
Prism displays the ANOVA results tab first, indicating whether there is an overall difference in means...
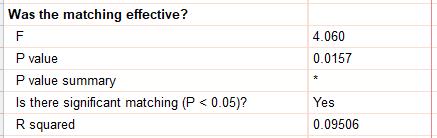
...and whether subject matching was effective (and hence increased the power to detect differences among means).
The ANOVA table is presented...

...as well as the post test results.

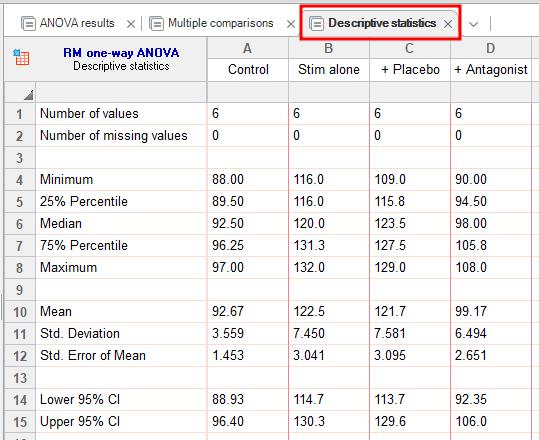
Finally, choose the Descriptive statistics tab.
Keywords: one way anova nonparametric