- Prism
FEATURES
Analyze, graph and present your workComprehensive analysis and statisticsElegant graphing and visualizationsShare, view and discuss your projectsLatest product features and releasesPOPULAR USE CASES
- Enterprise
- Resources
- Support
- Pricing
Prism 9.3.0 Release Notes
Prism 9.3.0 was released on November 15, 2021.
Cox Proportional Hazards Regression:
The latest advanced release from Prism Labs

Survival analysis is an extremely powerful statistical tool that is used to analyze "time to event" data, and generate estimates for how the probability of this event occurring changes over time. In the biological sciences, the "event" being studied is often death (of animals in a given experimental group, of humans with a particular disease process, etc.), giving this analysis its name. For a long time, Prism has offered a very simple form of survival analysis that uses the Kaplan-Meier estimation of survival. However, this technique is limited to creating survival curves for populations that are assumed to be homogeneous, and this method does not incorporate values for predictor variables that may have been collected for the individuals in the study (such as age, race, treatment group, etc.). Although survival curves generated using the Kaplan-Meier method for different groups (i.e. a "Treatment" group and a "Control" group) can be statistically compared, there's no way to include continuous predictor variables (such as age, blood pressure, weight, etc.) into these estimations.
Cox proportional hazards regression (or just Cox regression) is an advanced statistical method of survival analysis that allows for the incorporation of any number of predictor variables (both categorical and continuous predictor variables) into the model. Using all of the information collected for all of the individuals (in all of the different possible groups), Cox regression is able to generate survival estimates for any individual or group with any combination of predictor variable values. And - in Prism - creating graphs of these estimated survival curves for each of these different groups is easy. Simply pick the values you're most interested in, and Prism will automatically create a plot of the corresponding estimated survival curves. This latest release from the Prism Labs is one of the most statistically advanced analyses available within Prism, so be sure to check out our Statistics Guide pages for Cox Regression before diving in.
A New Welcome Dialog Experience
Getting started just got easier

Have you ever needed to run a new analysis or create a new type of graph, but just didn't know where to begin? We've all been there, and with the huge diversity of analyses and graphs to choose from in Prism, it can be a little overwhelming to try and figure it out on your own. That's why we've made it easier than ever to get to the help that you need in the format that's easiest to help you learn. In Prism 9.3.0, we've updated our Welcome Dialog to include a wide array of informative and educational resources for any level of user: from first-time Prism users to Prism power users.
Just getting started? The "Getting Started" page of the Welcome Dialog contains a whole set of videos you can watch or guides you can read to help you get familiarized with Prism and how it works.
Boost your Prism proficiency and efficiency! Use the Prism Academy link on the "Videos" page of the Welcome Dialog to master key concepts in statistics and data visualization. With over 125 video tutorials, you'll learn how to master unique tools and features within Prism to streamline your workflow.
Dive into the details! The "Prism Guides" page of the Welcome Dialog provides one-click access to hundreds of pages of detailed information for every single analysis, graph, and feature that Prism offers.
Browse some examples! The "Graph Portfolio" page of the Welcome Dialog includes a broad collection of different graph types and graph styles that can be made with Prism. Each of these examples contain instructions on how they were created, and they're perfect to use as a starting point to build graphs of your own data.
Updated Keyboard Shortcuts
Improving efficiency of your workflow

Sometimes it's just easier to press a quick combination of keys on the keyboard than to try and search through various menus to try and find the command you're looking for. Using keyboard shortcuts is a great way to increase efficiency within an application, and Prism is no exception. With 9.3.0, we updated a number of keyboard shortcuts for both the Windows and Mac versions of the software. But what good are keyboard shortcuts if you don't know what they are or what they do? Check out this list of keyboard shortcuts for both Windows and Mac, and start saving time!
Extract and Rearrange Improvements
Analyze extracted data without fussing with the format
Prism's Multiple Variables data table adopts a very standard data structure (with each column as a variable and each row as an observation), meaning data can often be entered into this table type with no need to manually rearrange it in another application like Excel. Once the data are in the Multiple Variables data table, the Extract and Rearrange analysis can be used to re-structure the data into the desired table format without copying and pasting data which could lead to potential errors.
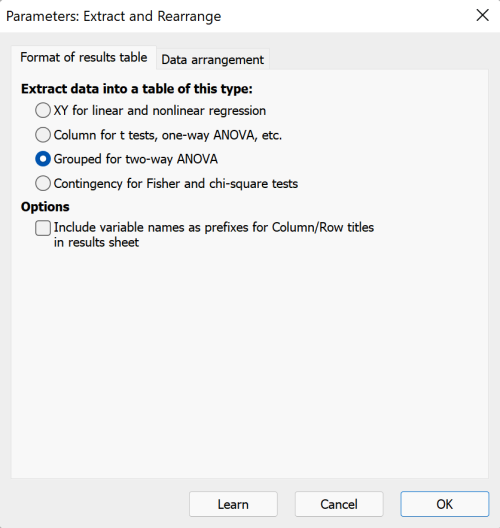
Previously, when selecting a categorical variable to be used as column or row titles, Prism would include the variable name as well as the variable value in the column/row title. In many cases - especially when entering text directly into the Multiple Variables data table - this was simply redundant. You would end up with titles like "Gender = 'Female'" and "Gender = 'Male'", when the titles "Female" and "Male" would have been just as informative, and much easier to read. In Prism 9.3.0, the Extract and Rearrange analysis will by default not include the variable name when creating column/row titles, and will only include the variable's value. However, if you'd still like to keep the variable name as a prefix (often useful when using numbers to represent groups instead of names), there is an option to do so in the analysis preferences dialog.
Support for New Operating Systems
Windows 11 and macOS Monterey

Prism 9.3.0 introduces improved support for both Windows 11 as well as macOS 12 Monterey! A number of known issues resulting from compatibility between Windows 11 and Prism have been fixed in 9.3.0 (more information can be found here). For anyone using either of these operating systems, we recommend updating to Prism 9.3.0.
Complete Release Notes for Prism 9.3.0
New features
- Introduced Cox Proportional Hazards Regression
- Introduced a new "Learn" section of the Welcome Dialog with educational resources including:
- Videos (Prism Academy)
- Getting started resources (videos and text)
- Links to each of the Prism guides
- Graph Portfolio
- Videos (Prism Academy)
Feature Improvements
- Updated the default behavior of the Extract and Rearrange analysis. When assigning levels of categorical variables to column or row titles, the variable name will be omitted by default. A new option in the analysis parameters dialog allows for inclusion of this label
- Improved Prism's equation manager and Nonlinear regression analysis to allow handling transforms of any combination of parameters
- Added Log (base 10) and Ln (natural log) transformations as options when defining models for multiple regression
- Improved performance of moving objects using arrow keys on graphs containing a large number of text objects
- Improved automatic recovery of Prism files with corrupted structures of pairwise comparisons on a graph
- Introduced the ability for non-Latin characters to be included in user-defined equations
- Updated the name of the parameters dialog for PCA to "Principal Component Analysis (PCA)" for consistency with the Analyze menu and dialog
- Renamed the analysis parameters dialog from "Parameters: Survival Curve" to "Simple Survival Analysis (Kaplan-Meier)"
- (Win) Implemented Ctrl+0 keyboard shortcut for Zoom 100%
- (Win) Implemented Ctrl+= keyboard shortcut for Zoom in and Ctrl+- keyboard shortcut for Zoom out
- (Win) Implemented Ctrl+Shift+> and Ctrl+Shift+< keyboard shortcuts for increasing or decreasing font size of selected text objects, respectively
- (Win) Implemented Ctrl+Shift+Down Arrow and Ctrl+Shift+Up Arrow keyboard shortcuts to select a range of cells in a data or results table from the currently active cell to the last cell containing data in the appropriate direction
- (Win) Added Microsoft Edge WebView2 runtime dependency to enable new features (only installed on older systems that do not already have WebView2)
- (Mac) Implemented Shift-Control-[Letter] keyboard shortcuts for the "Go to section" commands in the View main menu to browse between sheets (note: existing keyboard shortcuts were not removed)
- (Mac) Implemented Shift-Command-Right Arrow and Shift-Command-Left Arrow keyboard shortcut to select a range of cells in a data or results table from the currently active cell to the last cell containing data in the appropriate direction
- Improved support of Windows 11 and macOS 12 Monterey. It is recommended that Prism users running Windows 11 or macOS 12 update to Prism version 9.3.0
Analysis Bugs Fixed
- Fixed the issue in which Prism would crash upon changing parameters of a "Multiple linear regression" or "Multiple logistic regression" analysis after the variable types were changed in the source data table
- Fixed the issue in which the results of Two- and Three-way ANOVA performed with a mixed-effects model and matching by less than two factors were unexpectedly opened as frozen in older Prism versions
- Fixed the issue in which the floating note "Some results are left blank" did not appear on the empty Correlation results sheet if the source data table contained a variable with the same value in all rows
- Fixed the issue in which an incorrect value was shown for the lower bound of the confidence interval for the difference between proportions in the results of the "Chi-square (and Fishers' exact) test" analysis if the CI included zero. Read more about this issue here.
- (Win) Fixed the issue in which checkboxes appeared unchecked in the "Effect sizes to report" section in the "Main Calculations" tab of the "Parameters: Chi-square" dialog after closing the dialog from the "Options" tab and re-opening the dialog twice
- (Mac) Fixed the issue in which Prism would freeze when performing a "Nonlinear regression" analysis with the "Separate lower and upper limits" option selected for the CI output format
- (Mac) Fixed the issue in which the "No constraint" item was unexpectedly set by default instead of the "Constant equal to" item for the "Et" parameter of the built-in "kcat" equation (found in the "Enzyme kinetics - Velocity as a function of substrate" folder of equations)
Graphing Bugs Fixed
- Fixed the issue in which a separating line was not automatically added to Nested graphs for newly added data sets
- Fixed the issue in which the wrong automatic Y-axis range was set on column bar graphs (previously, Prism would incorrectly set a negative minimum value for the axis range while all values in the source data table were positive)
- Fixed the issue in which curves were incorrectly plotted on Survival graphs in projects created in Prism 6 and opened in Prism 9
- Fixed the issue in which bars on interleaved bar graphs were displayed as overlapping each other if the number of data sets exceeded the number of rows and the spacing for "Blank/missing values" was set to any value in the range [1,99]
- Fixed the issue in which a color scheme was applied only for legends on a graph after performing the Magic operation with the option "Apply formatting applied to individual points or bars" selected
- Fixed the issue in which symbols did not disappear from the Loading plot graph (PCA) after unchecking the "Show symbols" checkbox in the "Format Graph" dialog when the fill color was defined by a variable
- Fixed the issue in which the connecting line color for a selected color scheme was not applied to lines correctly on multiple variables graphs
- (Win) Fixed the issue in which graph frames were partially missing on layouts when both X and Y axes had been hidden and the graph contained no legend
- (Win) Fixed the issue in which connecting lines on "Repeated measures" graphs ere not shown if the data set had more than 1000 points
- (Win) Fixed the issue in which graphs became corrupted after pasting a single value from a green results sheet linked to the graph
- (Win) Fixed the issue in which semi-transparent color schemes were not applied to Parts of whole graphs
- (Win) Fixed the issue in which annotations were not correctly positioned if the data set was assigned to the right Y axis with a custom range
- (Win) Fixed the issue in which annotations were not displayed if one of the data sets was plotted on the right Y axis with a custom range
- (Win) Fixed the issue in which annotations were not displayed above bars if one data set was plotted on the right Y axis with a custom range
- (Win) Fixed the issue in which a Prism graph embedded as an OLE object within an MS Office document was corrupted after:
- reversing the data set order
- changing the default Y axis title, location, or rotation
- resizing it via smaller/larger commands
- resizing it by dragging the axes edges (multiple variables graphs)
- (Win) Fixed the issue in which the legends and plotting area of multiple variables graphs appeared misaligned after changing the size/color variable type from categorical to continuous if the graph was linked to a MS Office document
- (Mac) Fixed the inability to apply formatting to bars on grouped graphs with annotations added above or within the bars as well as pairwise comparison lines
- (Mac) Fixed the issue in which gaps between adjacent bars would be present on graphs while the gap spacing parameter was set to 0%
- (Mac) Fixed the issue in which the graph title did not automatically adjust its location upon changing the location of the Y axis title using the "Format Axes" dialog
- (Mac) [macOS 12 Monterey] Fixed the issue in which the "Open this folder after exporting" option did not work for graphs and layouts exported to PDF or EPS formats
- (Mac) Fixed the issue in which only part of graph titles were changed after applying the Magic operation with only the option "Change axis and graph titles to match example graph" selected
Other Bugs Fixed
- Fixed the issue in which the default Y-axis title location on graphs appeared as "Custom" in the "Location" dropdown menu of the Format Graph dialog
- Fixed the location of the left Y axis title on the graph in the "QC graph" Graph Portfolio file
- Fixed the location of the left Y axis title on the graph in the "Insert a picture" Graph Portfolio file
- Added an alert when entering a parameter in a user-defined equation with more than 20 characters: "Invalid equation. Parameter names can not contain more than 20 characters."
- Fixed the unexpected alert regarding an inability to use X or Y within parameter transform definitions when attempting to use more than one interpolation expression in the transform definition
- Fixed the issue in which values cleared from multiple variables data tables re-appeared in PZF documents
- (Win) Fixed the issue in which the error "The current sheet is not a data table!" occurred in an attempt to switch to a data table via script launched within a Prism file that contains two graphs from different families located on a single layout sheet
- (Win) Fixed the issue in which the slash ("/") symbol within an info constant value would be lost upon saving the Prism file
- (Win) Fixed the issue in which the option "Missing values are denoted by" in the "Filter" tab of the "Import and Paste Special Choices" dialog did not work for multiple variables data tables
- (Win) Fixed the issue in which it was impossible to perform the "Duplicate Current Sheet" command for Monte-Carlo results sheets
- (Win) Fixed the appropriate keyboard shortcuts to select a range of cells in Prism's tables from the selected cell to the last cell containing data (Shift+Ctrl+Left Arrow and Shift+Ctrl+Right Arrow)
- (Win) Fixed the keyboard shortcut to switch between sheets (Ctrl+Page Up and Ctrl+Page Down) so that it would correctly switch between all sheets in the "Data with Results" section of the Navigator instead of only switching between sheets of a single type
- (Win) Fixed the corrupted "Reload page" button in the LabArchives tab of the "Welcome to GraphPad Prism" dialog
- (Win) Fixed the issue in which Prism would crash upon creating a survival graph within a Prism project containing a huge amount of data tables
- (Win) Fixed the issue in which Prism would crash upon using the toolbar command to highlight a sheet in the Navigator
- (Win) Fixed the issue in which Prism would crash upon switching between sections in the "Analyze Data" dialog using the tab key
- (Win) Fixed the issue in which solid items instead of patterns appeared in the "Fill Pattern" dropdown menu of the contextual menu for bar/box/violins when the fill color for the corresponding data set was set to black in the "Define Color Scheme" dialog
- (Win) Fixed the issue in which a search was not performed upon selecting a recent search entry in the Navigator search bar
- (Win) Fixed the issue in which controls disappeared from the "Search" section in the Navigator after clicking the "OK" button in the "Preferences" dialog
- (Win) Removed unexpected item from the "P value style" dropdown menu in the "Parameters: Survival Curve" dialog
- (Win) Fixed the issue in which the "Disk or memory error occurred" alert was unexpectedly displayed while attempting to duplicate a family of sheets that include a layout that contains an embedded data table and a hooked constant from an info sheet
- (Win) Fixed the issue in which Prism would freeze when attempting to copy values from data tables between two Prism projects invoked from embedded graphs in an MS word document
- (Mac) Fixed the issue in which Prism would freeze when attempting to open the "Format Point" menu from the "Change" section of the toolbar on a data table with more than 300,000 values
- (Mac) Fixed the command to share all graphs and layouts in PDF format via email
- (Mac) Fixed the issue in which it was impossible to paste data from Apple's Numbers app to Prism's data tables using the "Paste Special" command
- (Mac) Fixed the issue in which categorical variables from Multiple Variables data tables were unexpectedly present in the "Replace Data Set" sheet invoked from the "Format Graph" dialog
- (Mac) Fixed the issue in which X subcolumns ("X" and "Err. Bar") appeared too narrow in XY data tables which contained Y replicates
- (Mac) [ARM processors] Fixed the issue in which the "Right" item in the Justification contextual menu for Y-axis titles was unexpectedly selected when the title was actually centered
- (Mac) Fixed the issue in which the "Vertical (Up)" rotation was selected instead of the "Vertical (Down)" rotation for the left Y axis title in the "Format Axes" dialog for a graph with an "Upper right" or "Lower right" origin location
- (Mac) Fixed the issue in which it was not possible to switch to the "Search" edit field in the "Analyze Data" dialog using the Tab key
- (Mac) Fixed the issue in which the results sheet was not updated after clearing the data table and re-opening the project
- (Mac) Fixed the issue in which Prism would crash upon attempting to enter a huge amount of text in the user-defined equation field in the Nonlinear regression dialog
- (Mac) Fixed the issue in which Prism would freeze while attempting to switch from the Interpolate tab of the Multiple Linear Regression parameters dialog after entering a row title for an interpolated point and reducing the number of points to interpolate
- (Mac) Fixed the issue in which Prism would crash while attempting to change a graph type in the "Change Graph Type" dialog if the source data set's name was longer than 50 characters
- (Mac) Fixed the issue in which the content of the "Go to a linked sheet within the family" status bar dropdown menu was not updated when invoked via the "Command-L" shortcut
- (Mac) Fixed the issue in which the "Command-L" shortcut did not work if the "Go to a linked sheet within the family" dropdown menu had not been invoked beforehand for the current family
- (Chinese) Updated the format of radio buttons in the "Which version of the file do you want to open" dialog to include dates at the beginning of the text
- (Chinese) Removed an empty line in the tooltip for the "Change colors" toolbar button
- (Chinese) Fixed corrupted text in the alert that appeared when entering serial numbers from older Prism version in the Register Prism dialog
- (Chinese) Fixed corrupted text in the alert that appeared when entering the wrong serial number in the Register Prism dialog
- (Chinese) Removed unexpected space in the title of the Export Graph dialog
Analyze, graph and present your scientific work easily with GraphPad Prism. No coding required.