- Prism
FEATURES
Analyze, graph and present your workComprehensive analysis and statisticsElegant graphing and visualizationsShare, view and discuss your projectsLatest product features and releasesPOPULAR USE CASES
- Enterprise
- Resources
- Support
- Pricing
The Ultimate Guide to ANOVA
ANOVA is the go-to analysis tool for classical experimental design, which forms the backbone of scientific research.
In this article, we’ll guide you through what ANOVA is, how to determine which version to use to evaluate your particular experiment, and provide detailed examples for the most common forms of ANOVA.
This includes a (brief) discussion of crossed, nested, fixed and random factors, and covers the majority of ANOVA models that a scientist would encounter before requiring the assistance of a statistician or modeling expert.
What is ANOVA used for?
ANOVA, or (Fisher’s) analysis of variance, is a critical analytical technique for evaluating differences between three or more sample means from an experiment. As the name implies, it partitions out the variance in the response variable based on one or more explanatory factors.
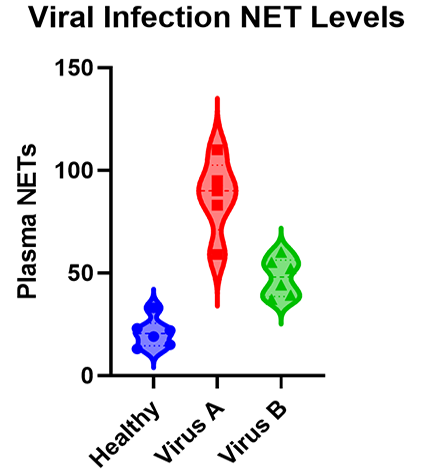
As you will see there are many types of ANOVA such as one-, two-, and three-way ANOVA as well as nested and repeated measures ANOVA. The graphic below shows a simple example of an experiment that requires ANOVA in which researchers measured the levels of neutrophil extracellular traps (NETs) in plasma across patients with different viral respiratory infections.
Many researchers may not realize that, for the majority of experiments, the characteristics of the experiment that you run dictate the ANOVA that you need to use to test the results. While it’s a massive topic (with professional training needed for some of the advanced techniques), this is a practical guide covering what most researchers need to know about ANOVA.
When should I use ANOVA?
If your response variable is numeric, and you’re looking for how that number differs across several categorical groups, then ANOVA is an ideal place to start. After running an experiment, ANOVA is used to analyze whether there are differences between the mean response of one or more of these grouping factors.
ANOVA can handle a large variety of experimental factors such as repeated measures on the same experimental unit (e.g., before/during/after).
If instead of evaluating treatment differences, you want to develop a model using a set of numeric variables to predict that numeric response variable, see linear regression and t tests.
What is the difference between one-way, two-way and three-way ANOVA?
The number of “ways” in ANOVA (e.g., one-way, two-way, …) is simply the number of factors in your experiment.
Although the difference in names sounds trivial, the complexity of ANOVA increases greatly with each added factor. To use an example from agriculture, let’s say we have designed an experiment to research how different factors influence the yield of a crop.
An experiment with a single factor
In the most basic version, we want to evaluate three different fertilizers. Because we have more than two groups, we have to use ANOVA. Since there is only one factor (fertilizer), this is a one-way ANOVA. One-way ANOVA is the easiest to analyze and understand, but probably not that useful in practice, because having only one factor is a pretty simplistic experiment.
What happens when you add a second factor?
If we have two different fields, we might want to add a second factor to see if the field itself influences growth. Within each field, we apply all three fertilizers (which is still the main interest). This is called a crossed design. In this case we have two factors, field and fertilizer, and would need a two-way ANOVA.
As you might imagine, this makes interpretation more complicated (although still very manageable) simply because more factors are involved. There is now a fertilizer effect, as well as a field effect, and there could be an interaction effect, where the fertilizer behaves differently on each field.
How about adding a third factor?
Finally, it is possible to have more than two factors in an ANOVA. In our example, perhaps you also wanted to test out different irrigation systems. You could have a three-way ANOVA due to the presence of fertilizer, field, and irrigation factors. This greatly increases the complication.
Now in addition to the three main effects (fertilizer, field and irrigation), there are three two-way interaction effects (fertilizer by field, fertilizer by irrigation, and field by irrigation), and one three-way interaction effect.
If any of the interaction effects are statistically significant, then presenting the results gets quite complicated. “Fertilizer A works better on Field B with Irrigation Method C ….”
In practice, two-way ANOVA is often as complex as many researchers want to get before consulting with a statistician. That being said, three-way ANOVAs are cumbersome, but manageable when each factor only has two levels.
What are crossed and nested factors?
In addition to increasing the difficulty with interpretation, experiments (or the resulting ANOVA) with more than one factor add another level of complexity, which is determining whether the factors are crossed or nested.
With crossed factors, every combination of levels among each factor is observed. For example, each fertilizer is applied to each field (so the fields are subdivided into three sections in this case).
With nested factors, different levels of a factor appear within another factor. An example is applying different fertilizers to each field, such as fertilizers A and B to field 1 and fertilizers C and D to field 2. See more about nested ANOVA here.
What are fixed and random factors?
Another challenging concept with two or more factors is determining whether to treat the factors as fixed or random.
Fixed factors are used when all levels of a factor (e.g., Fertilizer A, Fertilizer B, Fertilizer C) are specified and you want to determine the effect that factor has on the mean response.
Random factors are used when only some levels of a factor are observed (e.g., Field 1, Field 2, Field 3) out of a large or infinite possible number (e.g., all fields), but rather than specify the effect of the factor, which you can’t do because you didn’t observe all possible levels, you want to quantify the variability that’s within that factor (variability added within each field).
Many introductory courses on ANOVA only discuss fixed factors, and we will largely follow suit other than with two specific scenarios (nested factors and repeated measures).
What are the (practical) assumptions of ANOVA?
These are one-way ANOVA assumptions, but also carryover for more complicated two-way or repeated measures ANOVA.
- Categorical treatment or factor variables - ANOVA evaluates mean differences between one or more categorical variables (such as treatment groups), which are referred to as factors or “ways.”
- Three or more groups - There must be at least three distinct groups (or levels of a categorical variable) across all factors in an ANOVA. The possibilities are endless: one factor of three different groups, two factors of two groups each (2x2), and so on. If you have fewer than three groups, you can probably get away with a simple t-test.
- Numeric Response - While the groups are categorical, the data measured in each group (i.e., the response variable) still needs to be numeric. ANOVA is fundamentally a quantitative method for measuring the differences in a numeric response between groups. If your response variable isn’t continuous, then you need a more specialized modelling framework such as logistic regression or chi-square contingency table analysis to name a few.
- Random assignment - The makeup of each experimental group should be determined by random selection.
- Normality - The distribution within each factor combination should be approximately normal, although ANOVA is fairly robust to this assumption as the sample size increases due to the central limit theorem.
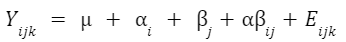
What is the formula for ANOVA?
The formula to calculate ANOVA varies depending on the number of factors, assumptions about how the factors influence the model (blocking variables, fixed or random effects, nested factors, etc.), and any potential overlap or correlation between observed values (e.g., subsampling, repeated measures).
The good news about running ANOVA in the 21st century is that statistical software handles the majority of the tedious calculations. The main thing that a researcher needs to do is select the appropriate ANOVA.
An example formula for a two-factor crossed ANOVA is:
How do I know which ANOVA to use?
As statisticians, we like to imagine that you’re reading this before you’ve run your experiment. You can save a lot of headache by simplifying an experiment into a standard format (when possible) to make the analysis straightforward.
Regardless, we’ll walk you through picking the right ANOVA for your experiment and provide examples for the most popular cases. The first question is:
Do you only have a single factor of interest?
If you have only measured a single factor (e.g., fertilizer A, fertilizer B, .etc.), then use one-way ANOVA. If you have more than one, then you need to consider the following:
Are you measuring the same observational unit (e.g., subject) multiple times?
This is where repeated measures come into play and can be a really confusing question for researchers, but if this sounds like it might describe your experiment, see repeated measures ANOVA. Otherwise:
Are any of the factors nested, where the levels are different depending on the levels of another factor?
In this case, you have a nested ANOVA design. If you don’t have nested factors or repeated measures, then it becomes simple:
Do you have two categorical factors?
Then use two-way ANOVA.
Do you have three categorical factors?
Use three-way ANOVA.
Do you have variables that you recorded that aren’t categorical (such as age, weight, etc.)?
Although these are outside the scope of this guide, if you have a single continuous variable, you might be able to use ANCOVA, which allows for a continuous covariate. With multiple continuous covariates, you probably want to use a mixed model or possibly multiple linear regression.
Prism does offer multiple linear regression but assumes that all factors are fixed. A full “mixed model” analysis is not yet available in Prism, but is offered as options within the one- and two-way ANOVA parameters.
How do I perform ANOVA?
Once you’ve determined which ANOVA is appropriate for your experiment, use statistical software to run the calculations. Below, we provide detailed examples of one, two and three-way ANOVA models.
How do I read and interpret an ANOVA table?
Interpreting any kind of ANOVA should start with the ANOVA table in the output. These tables are what give ANOVA its name, since they partition out the variance in the response into the various factors and interaction terms. This is done by calculating the sum of squares (SS) and mean squares (MS), which can be used to determine the variance in the response that is explained by each factor.
If you have predetermined your level of significance, interpretation mostly comes down to the p-values that come from the F-tests. The null hypothesis for each factor is that there is no significant difference between groups of that factor. All of the following factors are statistically significant with a very small p-value.

One-way ANOVA Example
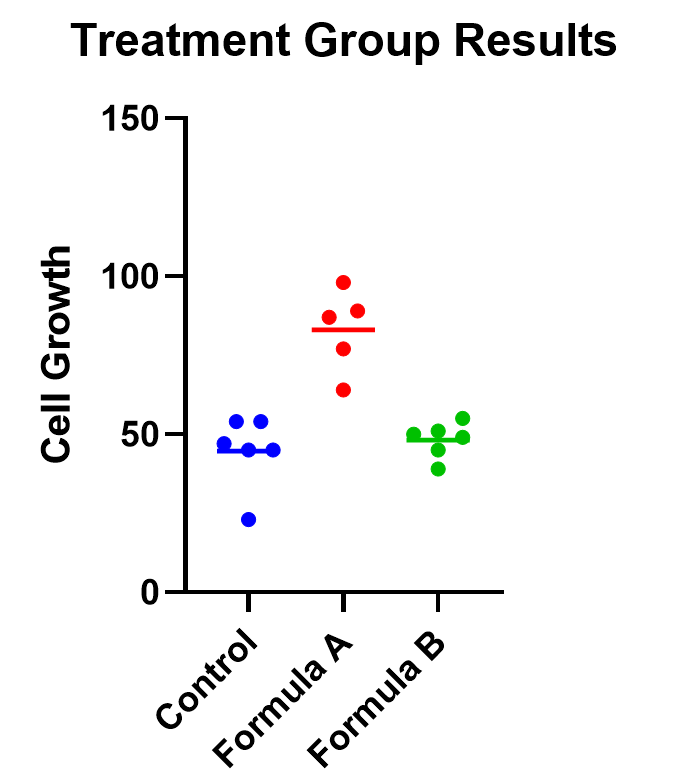
An example of one-way ANOVA is an experiment of cell growth in petri dishes. The response variable is a measure of their growth, and the variable of interest is treatment, which has three levels: formula A, formula B, and a control.
Classic one-way ANOVA assumes equal variances within each sample group. If that isn’t a valid assumption for your data, you have a number of alternatives.
Calculating a one-way ANOVA
Using Prism to do the analysis, we will run a one-way ANOVA and will choose 95% as our significance threshold. Since we are interested in the differences between each of the three groups, we will evaluate each and correct for multiple comparisons (more on this later!).
For the following, we’ll assume equal variances within the treatment groups. Consider

The first test to look at is the overall (or omnibus) F-test, with the null hypothesis that there is no significant difference between any of the treatment groups. In this case, there is a significant difference between the three groups (p<0.0001), which tells us that at least one of the groups has a statistically significant difference.
Now we can move to the heart of the issue, which is to determine which group means are statistically different. To learn more, we should graph the data and test the differences (using a multiple comparison correction).
Graphing one-way ANOVA
The easiest way to visualize the results from an ANOVA is to use a simple chart that shows all of the individual points. Rather than a bar chart, it’s best to use a plot that shows all of the data points (and means) for each group such as a scatter or violin plot.
As an example, below you can see a graph of the cell growth levels for each data point in each treatment group, along with a line to represent their mean. This can help give credence to any significant differences found, as well as show how closely groups overlap.
Determining statistical significance between groups
In addition to the graphic, what we really want to know is which treatment means are statistically different from each other. Because we are performing multiple tests, we’ll use a multiple comparison correction. For our example, we’ll use Tukey’s correction (although if we were only interested in the difference between each formula to the control, we could use Dunnett’s correction instead).
In this case, the mean cell growth for Formula A is significantly higher than the control (p<.0001) and Formula B (p=0.002), but there’s no significant difference between Formula B and the control.

Two-way ANOVA example
For two-way ANOVA, there are two factors involved. Our example will focus on a case of cell lines. Suppose we have a 2x2 design (four total groupings). There are two different treatments (serum-starved and normal culture) and two different fields. There are 19 total cell line “experimental units” being evaluated, up to 5 in each group (note that with 4 groups and 19 observational units, this study isn’t balanced). Although there are multiple units in each group, they are all completely different replicates and therefore not repeated measures of the same unit.
As with one-way ANOVA, it’s a good idea to graph the data as well as look at the ANOVA table for results.
Graphing two-way ANOVA
There are many options here. Like our one-way example, we recommend a similar graphing approach that shows all the data points themselves along with the means.
Determining statistical significance between groups in two-way ANOVA
Let’s use a two-way ANOVA with a 95% significance threshold to evaluate both factors’ effects on the response, a measure of growth.
Feel free to use our two-way ANOVA checklist as often as you need for your own analysis.
First, notice there are three sources of variation included in the model, which are interaction, treatment, and field.
The first effect to look at is the interaction term, because if it’s significant, it changes how you interpret the main effects (e.g., treatment and field). The interaction effect calculates if the effect of a factor depends on the other factor. In this case, the significant interaction term (p<.0001) indicates that the treatment effect depends on the field type.

A significant interaction term muddies the interpretation, so that you no longer have the simple conclusion that “Treatment A outperforms Treatment B.” In this case, the graphic is particularly useful. It suggests that while there may be some difference between three of the groups, the precise combination of serum starved in field 2 outperformed the rest.
To confirm whether there is a statistically significant result, we would run pairwise comparisons (comparing each factor level combination with every other one) and account for multiple comparisons.
Do I need to correct for multiple comparisons for two-way ANOVA?
If you’re comparing the means for more than one combination of treatment groups, then absolutely! Here’s more information about multiple comparisons for two-way ANOVA.
Repeated measures ANOVA
So far we have focused almost exclusively on “ordinary” ANOVA and its differences depending on how many factors are involved. In all of these cases, each observation is completely unrelated to the others. Other than the combination of factors that may be the same across replicates, each replicate on its own is independent.
There is a second common branch of ANOVA known as repeated measures. In these cases, the units are related in that they are matched up in some way. Repeated measures are used to model correlation between measurements within an individual or subject. Repeated measures ANOVA is useful (and increases statistical power) when the variability within individuals is large relative to the variability among individuals.
It’s important that all levels of your repeated measures factor (usually time) are consistent. If they aren’t, you’ll need to consider running a mixed model, which is a more advanced statistical technique.
There are two common forms of repeated measures:
- You observe the same individual or subject at different time points. If you’re familiar with paired t-tests, this is an extension to that. (You can also have the same individual receive all of the treatments, which adds another level of repeated measures.)
- You have a randomized block design, where matched elements receive each treatment. For example, you split a large sample of blood taken from one person into 3 (or more) smaller samples, and each of those smaller samples gets exactly one treatment.
Repeated measures ANOVA can have any number of factors. See analysis checklists for one-way repeated measures ANOVA and two-way repeated measures ANOVA.
What does it mean to assume sphericity with repeated measures ANOVA?
Repeated measures are almost always treated as random factors, which means that the correlation structure between levels of the repeated measures needs to be defined. The assumption of sphericity means that you assume that each level of the repeated measures has the same correlation with every other level.
This is almost never the case with repeated measures over time (e.g., baseline, at treatment, 1 hour after treatment), and in those cases, we recommend not assuming sphericity. However, if you used a randomized block design, then sphericity is usually appropriate.
Example two-way ANOVA with repeated measures
Say we have two treatments (control and treatment) to evaluate using test animals. We’ll apply both treatments to each two animals (replicates) with sufficient time in between the treatments so there isn’t a crossover (or carry-over) effect. Also, we’ll measure five different time points for each treatment (baseline, at time of injection, one hour after, …). This is repeated measures because we will need to measure matching samples from the same animal under each treatment as we track how its stimulation level changes over time.

The output shows the test results from the main and interaction effects. Due to the interaction between time and treatment being significant (p<.0001), the fact that the treatment main effect isn’t significant (p=.154) isn’t noteworthy.
Graphing repeated measures ANOVA
As we’ve been saying, graphing the data is useful, and this is particularly true when the interaction term is significant. Here we get an explanation of why the interaction between treatment and time was significant, but treatment on its own was not. As soon as one hour after injection (and all time points after), treated units show a higher response level than the control even as it decreases over those 12 hours. Thus the effect of time depends on treatment. At the earlier time points, there is no difference between treatment and control.

Graphing repeated measures data is an art, but a good graphic helps you understand and communicate the results. For example, it’s a completely different experiment, but here’s a great plot of another repeated measures experiment with before and after values that are measured on three different animal types.

What if I have three or more factors?
Interpreting three or more factors is very challenging and usually requires advanced training and experience.
Just as two-way ANOVA is more complex than one-way, three-way ANOVA adds much more potential for confusion. Not only are you dealing with three different factors, you will now be testing seven hypotheses at the same time. Two-way interactions still exist here, and you may even run into a significant three-way interaction term.
It takes careful planning and advanced experimental design to be able to untangle the combinations that will be involved (see more details here).
Non-parametric ANOVA alternatives
As with t-tests (or virtually any statistical method), there are alternatives to ANOVA for testing differences between three groups. ANOVA is means-focused and evaluated in comparison to an F-distribution.
The two main non-parametric cousins to ANOVA are the Kruskal-Wallis and Friedman’s tests. Just as is true with everything else in ANOVA, it is likely that one of the two options is more appropriate for your experiment.
Kruskal-Wallis tests the difference between medians (rather than means) for 3 or more groups. It is only useful as an “ordinary ANOVA” alternative, without matched subjects like you have in repeated measures. Here are some tips for interpreting Kruskal-Wallis test results.
Friedman’s Test is the opposite, designed as an alternative to repeated measures ANOVA with matched subjects. Here are some tips for interpreting Friedman's Test.
ANOVA FAQs
What are simple, main, and interaction effects in ANOVA?
Consider the two-way ANOVA model setup that contains two different kinds of effects to evaluate:
The 𝛼 and 𝛽 factors are “main” effects, which are the isolated effect of a given factor. “Main effect” is used interchangeably with “simple effect” in some textbooks.
The interaction term is denoted as “𝛼𝛽”, and it allows for the effect of a factor to depend on the level of another factor. It can only be tested when you have replicates in your study. Otherwise, the error term is assumed to be the interaction term.
What are multiple comparisons?
When you’re doing multiple statistical tests on the same set of data, there’s a greater propensity to discover statistically significant differences that aren’t true differences. Multiple comparison corrections attempt to control for this, and in general control what is called the familywise error rate. There are a number of multiple comparison testing methods, which all have pros and cons depending on your particular experimental design and research questions.
What does the word “way” mean in one-way vs two-way ANOVA?
In statistics overall, it can be hard to keep track of factors, groups, and tails. To the untrained eye “two-way ANOVA” could mean any of these things.
The best way to think about ANOVA is in terms of factors or variables in your experiment. Suppose you have one factor in your analysis (perhaps “treatment”). You will likely see that written as a one-way ANOVA. Even if that factor has several different treatment groups, there is only one factor, and that’s what drives the name.
Also, “way” has absolutely nothing to do with “tails” like a t-test. ANOVA relies on F tests, which can only test for equal vs unequal because they rely on squared terms. So ANOVA does not have the “one-or-two tails” question.
What is the difference between ANOVA and a t-test?
ANOVA is an extension of the t-test. If you only have two group means to compare, use a t-test. Anything more requires ANOVA.
What is the difference between ANOVA and chi-square?
Chi-square is designed for contingency tables, or counts of items within groups (e.g., type of animal). The goal is to see whether the counts in a particular sample match the counts you would expect by random chance.
ANOVA separates subjects into groups for evaluation, but there is some numeric response variable of interest (e.g., glucose level).
Can ANOVA evaluate effects on multiple response variables at the same time?
Multiple response variables makes things much more complicated than multiple factors. ANOVA (as we’ve discussed it here) can obviously handle multiple factors but it isn’t designed for tracking more than one response at a time.
Technically, there is an expansion approach designed for this called Multivariate (or Multiple) ANOVA, or more commonly written as MANOVA. Things get complicated quickly, and in general requires advanced training.
Can ANOVA evaluate numeric factors in addition to the usual categorical factors?
It sounds like you are looking for ANCOVA (analysis of covariance). You can treat a continuous (numeric) factor as categorical, in which case you could use ANOVA, but this is a common point of confusion.
What is the definition of ANOVA?
ANOVA stands for analysis of variance, and, true to its name, it is a statistical technique that analyzes how experimental factors influence the variance in the response variable from an experiment.
What is blocking in Anova?
Blocking is an incredibly powerful and useful strategy in experimental design when you have a factor that you think will heavily influence the outcome, so you want to control for it in your experiment. Blocking affects how the randomization is done with the experiment. Usually blocking variables are nuisance variables that are important to control for but are not inherently of interest.
A simple example is an experiment evaluating the efficacy of a medical drug and blocking by age of the subject. To do blocking, you must first gather the ages of all of the participants in the study, appropriately bin them into groups (e.g., 10-30, 30-50, etc.), and then randomly assign an equal number of treatments to the subjects within each group.
There’s an entire field of study around blocking. Some examples include having multiple blocking variables, incomplete block designs where not all treatments appear in all blocks, and balanced (or unbalanced) blocking designs where equal (or unequal) numbers of replicates appear in each block and treatment combination.
What is ANOVA in statistics?
For a one-way ANOVA test, the overall ANOVA null hypothesis is that the mean responses are equal for all treatments. The ANOVA p-value comes from an F-test.
Can I do ANOVA in R?
While Prism makes ANOVA much more straightforward, you can use open-source coding languages like R as well. Here are some examples of R code for repeated measures ANOVA, both one-way ANOVA in R and two-way ANOVA in R.
Perform your own ANOVA
Are you ready for your own Analysis of variance? Prism makes choosing the correct ANOVA model simple and transparent.
Start your 30 day free trial of Prism and get access to:
- A step by step guide on how to perform ANOVA
- Sample data to save you time
- More tips on how Prism can help your research
With Prism, in a matter of minutes you learn how to go from entering data to performing statistical analyses and generating high-quality graphs.
Analyze, graph and present your scientific work easily with GraphPad Prism. No coding required.