
How Do I Estimate the IC50 and EC50?
IC50 and EC50, which are common metrics in pharmacological research, are estimated using dose-response models. In GraphPad, these are found in the curve fitting sections. We have a lot of great information about IC50 and EC50. In this article, we provide a summary, link to additional content, and address some of the frequently asked questions when a model doesn’t fit.
What are IC50 and EC50?
IC50 and EC50 are, respectively, the inhibition and effective concentrations that produce 50% of maximal response from a drug or treatment dose. If you haven’t read it already, we recommend this excellent article, which details the ideal IC50 scenario (see photo below) and clarifies several choices that need to be made when fitting IC50. These include how to fit the endpoint values (effectively the none versus infinite dosing), choosing relative (recommended) versus absolute IC50, and a discussion on normalizing the data (generally unnecessary) so that the response is between 0 and 100.
Your choice of modeling IC50 or EC50 is simply based on whether you’re modeling an inhibitor (antagonist) or a stimulant (agonist). We choose the convention for the remaining article to discuss the half-maximal response in terms of IC50.

Initial Choices for Modeling IC50
There are several initial choices to make when modeling IC50. If you are interested in modeling IC50 in GraphPad, in particular, see this guide for choosing your model. Regardless, you’ll need to decide:
- Which parameters to estimate and which to set as fixed
- Between log transforming the concentration values or not
- On setting additional parameters (such as the top and bottom) as constant
- If you want to share parameters across multiple experiments
- Between modeling relative or absolute IC50
- Whether or not to normalize your response, Y, values to be between 0 and 100%
Prism offers four sets of equations for dose-response curves. Start your free trial of Prism today.
Choosing the number of parameters to estimate in the model
The three and four parameter dose-response models are the most common. However, in some situations, it’s necessary to estimate more (or fewer) parameters.

The parameters used in the standard three parameter dose-response model are:
- Top - the estimate of the top plateau
- Bottom - an estimate of the bottom plateau
- IC50 - an estimate of the dose required to produce 50% of the maximal result
A four parameter model adds:
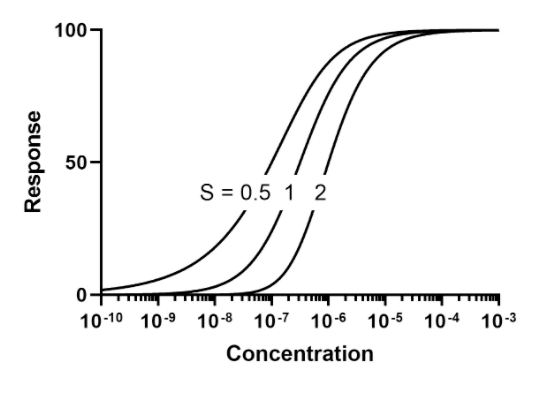
- Hillslope - an estimated slope factor used to adjust the steepness of the logistic curve (Note that in the three parameter model, this is fixed at one)
Use a four parameter model if you have reason to believe (from your data or previous research) that the hillslope is not one. If you’re unsure and you have plenty of well-behaved data points, then estimating the additional parameter poses no problems and is recommended.
Setting additional parameters as fixed
There are scenarios where other parameters, such as the Top or Bottom are known, and can be fixed rather than estimated. The most common case is when the data are normalized, so that the Top and Bottom can be fixed at 0 and 100, which is discussed more below.
Estimating more than four parameters
Sometimes even the four parameter model isn’t flexible enough to fit the data well. If the upper and lower curves are asymmetric, you can add an additional parameter and fit a five parameter model to address this. If you haven’t tried a log transformation on the X values, you might want to fit that first. The additional parameter is correlated with the other estimates, which increases the confidence intervals substantially. This is described in detail in our guide with additional info available here.
Prism has a built-in equation to help you fit a five parameter concentration-response curve. Get started in Prism with a free trial.
Log transformations on X
You can model the dose concentrations on a regular or log scale. Your data will dictate which is more appropriate in your case based on how well the model fits.
Sharing parameters
In some cases, you might want to share parameters between dose-response curves. This situation arises when, for example, the top and bottom values are known to be equivalent, but the IC50s and possible hill slope vary. See this example for details on sharing parameters in dose-response curves in Prism.
To Normalize or Not?
It isn’t necessary to normalize your Y values to be between 0 and 100 in order to fit dose-response, however sometimes due to convention or for interpretability, it’s preferred. If this applies to your situation, read this discussion on fitting normalized data.
Prism's normalize analysis makes it easy to normalize your y values to be between 0 and 100. Try normalizing your data in Prism with a free trial.
What to do if the dose-response model isn’t fitting well
Some common issues can arise with your model fit. This troubleshooting guide walks you through an analysis checklist and some helpful questions to ask yourself after fitting a dose-response model.
Sometimes an ill-fitting model is due to insufficient or incomplete data that doesn’t provide information on one of the parameters (e.g., the bottom or top plateau). Theoretically, the “best” solution would be to run more experiments at additional concentration levels to better identify the curve, but practically that’s often prohibited by cost or time. Before running additional experiments, you may find a better fit by transforming your dose concentrations or constraining some of the parameters (if appropriate).

In this example with an ambiguous fit (see above plot), the data is insufficient to define the Bottom of the curve. Prism will give point estimates for the IC50, but the confidence intervals are either very large or unable to be calculated at all. In this particular case, the bottom of the curve is known in advance to be zero. This will not always be the case, but in this situation, constraining the bottom to be zero addresses the ambiguous fit.
Additional Resources on modeling IC50 in Prism
Thanks to our community, we have some additional great video resources on YouTube for finding the IC50 in Prism and finding the ECAnything, which is Prism shorthand for the EC80 or EC90, or whatever percent of maximal is desired.