
-
Prism
FEATURES
Analyze, graph and present your workComprehensive analysis and statisticsElegant graphing and visualizationsShare, view and discuss your projectsLatest product features and releasesPOPULAR USE CASES
- Enterprise
- Resources
- Support
- Pricing
T test calculator
A t test compares the means of two groups. There are several types of two sample t tests and this calculator focuses on the three most common: unpaired, welch's, and paired t tests.
Directions for using the calculator are listed below, along with more information about two sample t tests and help on which is appropriate for your analysis.
NOTE: This is not the same as a one sample t test; for that, you need this One sample t test calculator.
What is a t test?
A t test is used to measure the difference between exactly two means. Its focus is on the same numeric data variable rather than counts or correlations between multiple variables. If you are taking the average of a sample of measurements, t tests are the most commonly used method to evaluate that data. It is particularly useful for small samples of less than 30 observations. For example, you might compare whether systolic blood pressure differs between a control and treated group, between men and women, or any other two groups.
This calculator uses a two-sample t test, which compares two datasets to see if their means are statistically different. That is different from a one sample t test, which compares the mean of your sample to some proposed theoretical value.
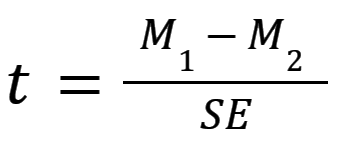
The most general formula for a t test is composed of two means (M1 and M2) and the overall standard error (SE) of the two samples:
See our video on How to Perform a Two-sample t test for an intuitive explanation of t tests and an example.
How to use the t test calculator
- Choose your data entry format. This will change how section 3 on the page looks. The first two options are for entering your data points themselves, either manually or by copy & paste. The last two are for entering the means for each group, along with the number of observations (N) and either the standard error of that mean (SEM) or standard deviation of the dataset (SD) standard error. If you have already calculated these summary statistics, the latter options will save you time.
- Choose a test from the three options: Unpaired t test, Welch's unpaired t test, or Paired t test. Use our Ultimate Guide to t tests if you are unsure which is appropriate, as it includes a section on "How do I know which t test to use?". Notice not all options are available if you enter means only.
- Enter data for the test, based on the format you chose in Step 1.
- Click Calculate Now and View the results. All options will perform a two-tailed test.
Performing t tests? We can help.
Sign up for more information on how to perform t tests and other common statistical analyses.
Common t test confusion
In addition to the number of t test options, t tests are often confused with completely different techniques as well. Here's how to keep them all straight.
Correlation and regression are used to measure how much two factors move together. While t tests are part of regression analysis, they are focused on only one factor by comparing means in different samples.
ANOVA is used for comparing means across three or more total groups. In contrast, t tests compare means between exactly two groups.
Finally, contingency tables compare counts of observations within groups rather than a calculated average. Since t tests compare means of continuous variable between groups, contingency tables use methods such as chi square instead of t tests.
Assumptions of t tests
Because there are several versions of t tests, it's important to check the assumptions to figure out which is best suited for your project. Here are our analysis checklists for unpaired t tests and paired t tests, which are the two most common. These (and the ultimate guide to t tests) go into detail on the basic assumptions underlying any t test:
- Exactly two groups
- Sample is normally distributed
- Independent observations
- Unequal or equal variance?
- Paired or unpaired data?
Interpreting results
The three different options for t tests have slightly different interpretations, but they all hinge on hypothesis testing and P values. You need to select a significance threshold for your P value (often 0.05) before doing the test.
While P values can be easy to misinterpret, they are the most commonly used method to evaluate whether there is evidence of a difference between the sample of data collected and the null hypothesis. Once you have run the correct t test, look at the resulting P value. If the test result is less than your threshold, you have enough evidence to conclude that the data are significantly different.
If the test result is larger or equal to your threshold, you cannot conclude that there is a difference. However, you cannot conclude that there was definitively no difference either. It's possible that a dataset with more observations would have resulted in a different conclusion.
Depending on the test you run, you may see other statistics that were used to calculate the P value, including the mean difference, t statistic, degrees of freedom, and standard error. The confidence interval and a review of your dataset is given as well on the results page.
Graphing t tests
This calculator does not provide a chart or graph of t tests, however, graphing is an important part of analysis because it can help explain the results of the t test and highlight any potential outliers. See our Prism guide for some graphing tips for both unpaired and paired t tests.
Prism is built for customized, publication quality graphics and charts. For t tests we recommend simply plotting the datapoints themselves and the mean, or an estimation plot. Another popular approach is to use a violin plot, like those available in Prism.
For more information
Our ultimate guide to t tests includes examples, links, and intuitive explanations on the subject. It is quite simply the best place to start if you're looking for more about t tests!
If you enjoyed this calculator, you will love using Prism for analysis. Take a free 30-day trial to do more with your data, such as:
- Clear guidance to pick the right t test and detailed results summaries
- Custom, publication quality t test graphics, violin plots, and more
- More t test options, including normality testing as well as nested and multiple t tests
- Non-parametric test alternatives such as Wilcoxon, Mann-Whitney, and Kolmogorov-Smirnov
Check out our video on how to perform a t test in Prism, for an example from start to finish!
Remember, this page is just for two sample t tests. If you only have one sample, you need to use this calculator instead.
We Recommend:
Video: How to Perform a t test
Prism Academy: Master key concepts in statistics and data visualization
Analyze, graph and present your scientific work easily with GraphPad Prism. No coding required.